This native integration requires a Zencoder account.
Overview
The Sentry integration gives the AI agent access to your error monitoring and incident data. Track exceptions, monitor application health, surface recurring issues, and generate incident reports — all from within a Zenflow task.Sentry integration is based on Sentry MCP
Connecting Sentry
Authorize Connection
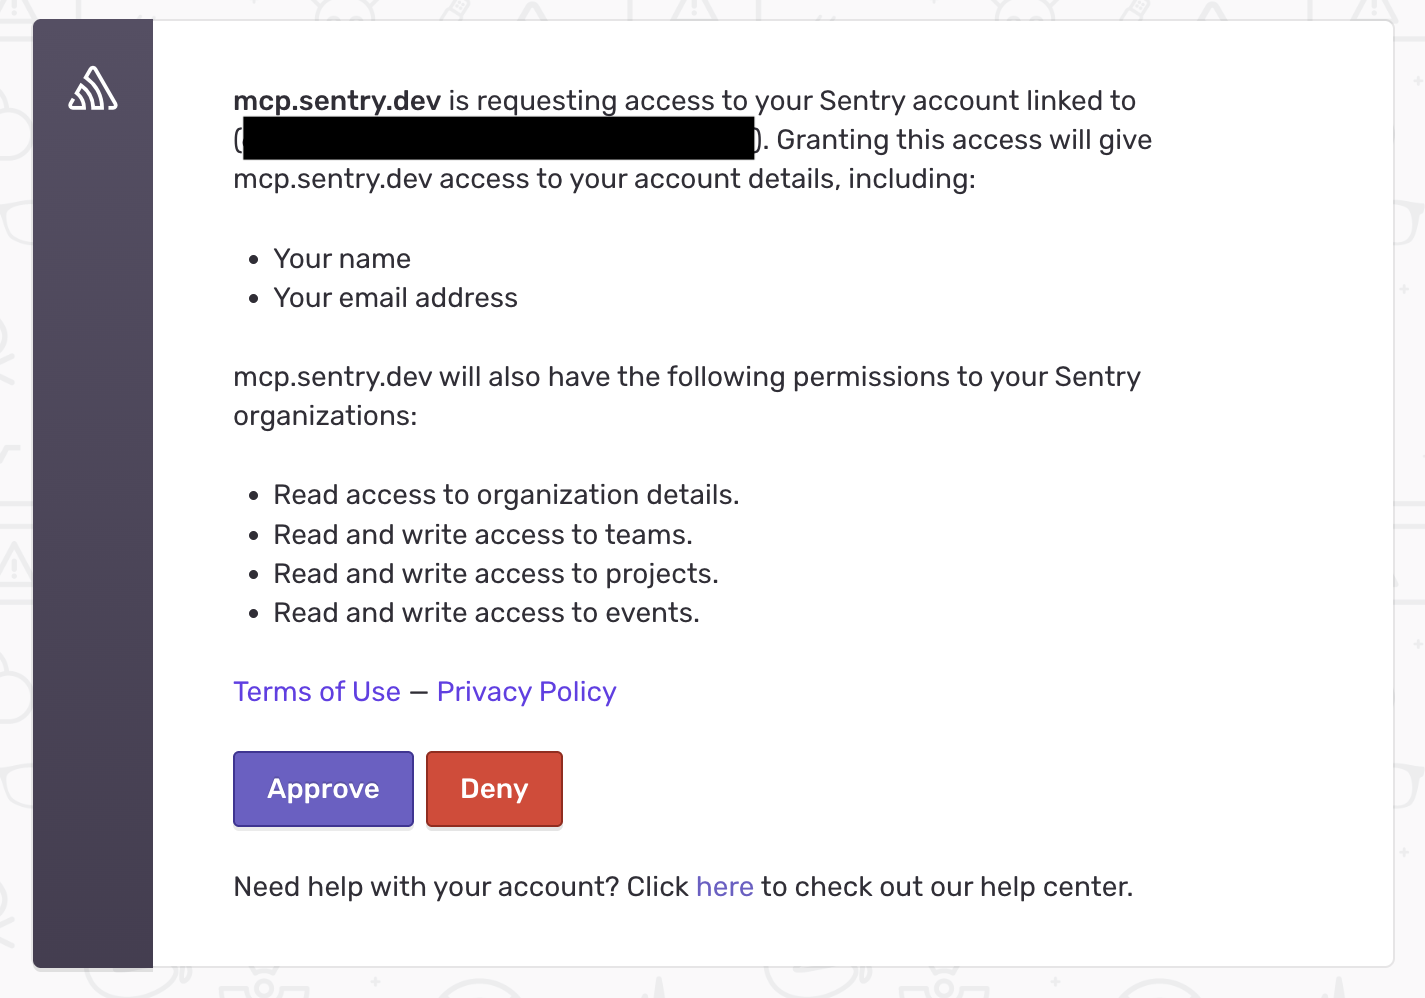
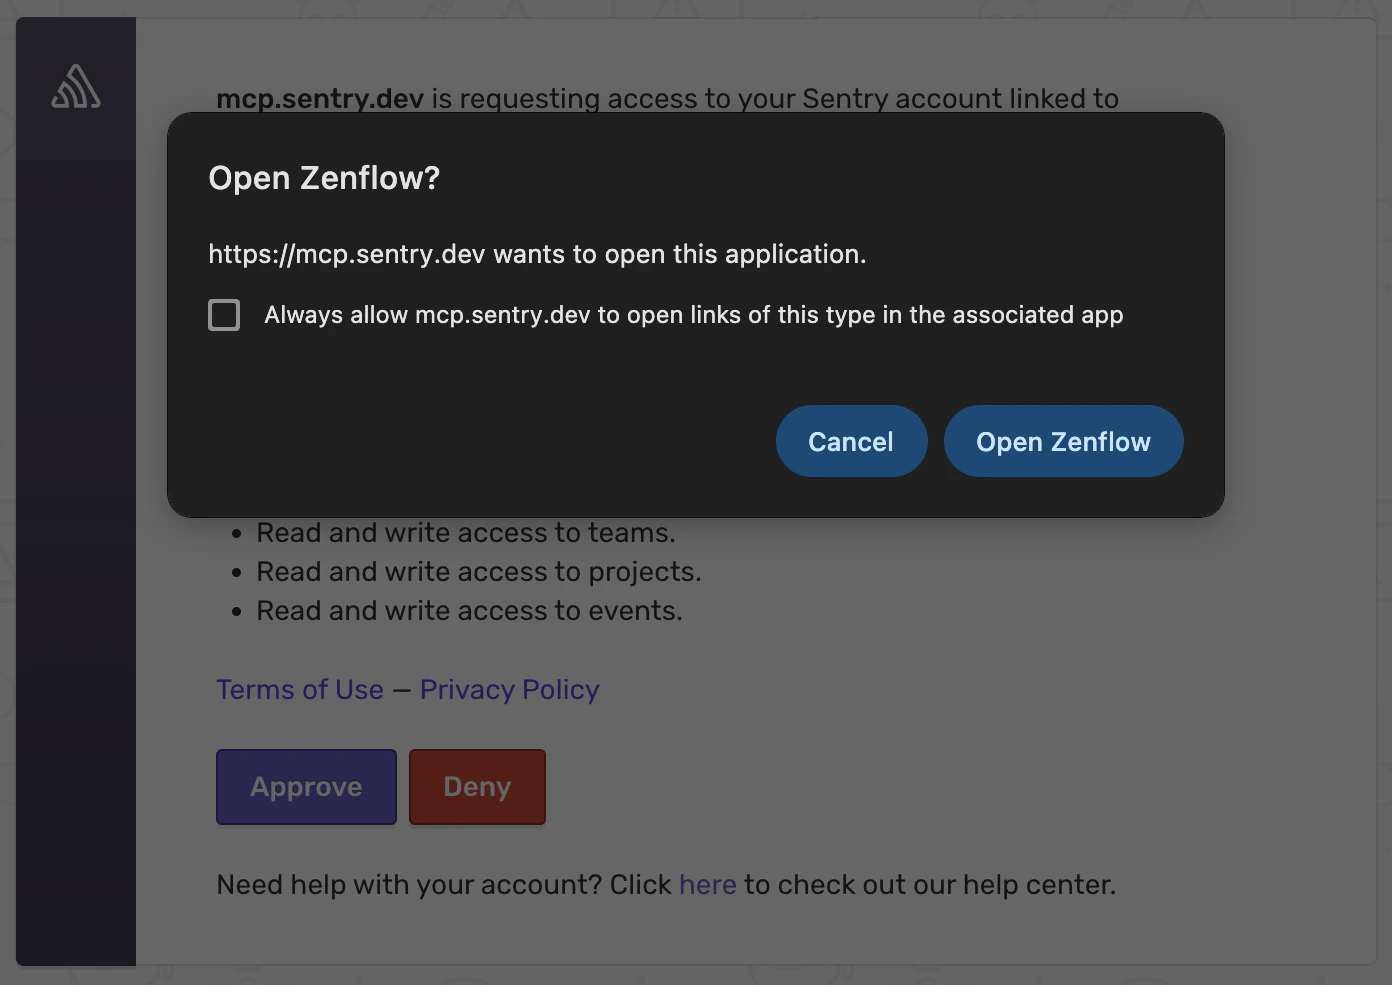
Authenticate and authorize Zenflow to access your Sentry workspace via the secure OAuth popup window:
Select desired scopes, click Approve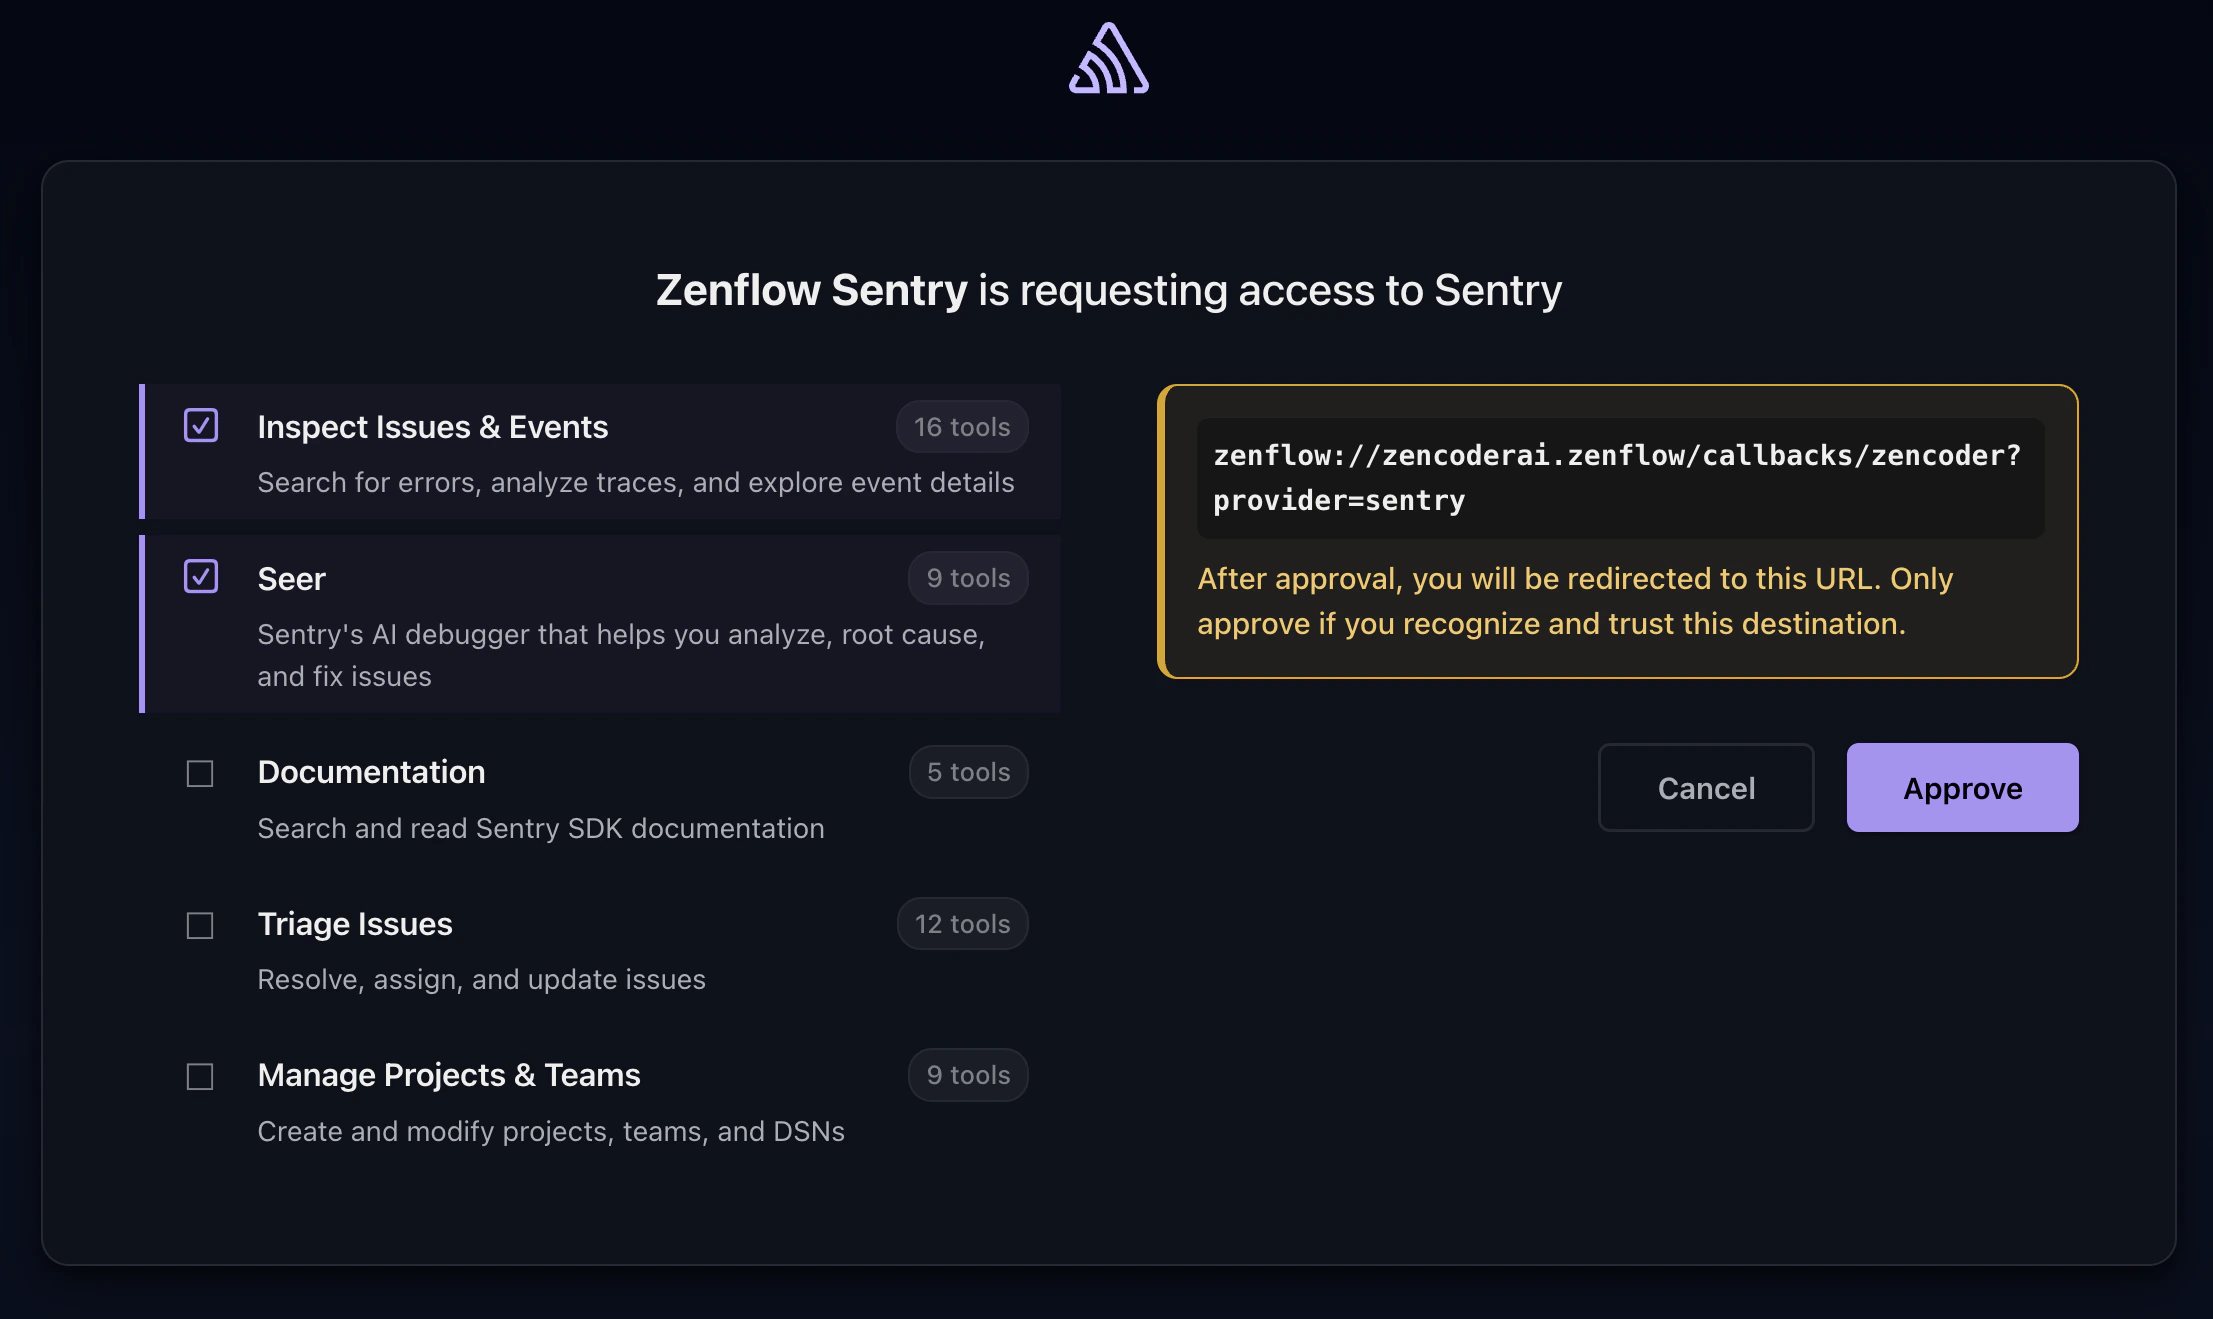

What the Agent Can Do
- Monitor errors — Access exception data, stack traces, and error frequency
- Track incidents — View active incidents, their status, and resolution history
- Surface trends — Identify recurring issues and regression patterns
- Generate reports — Compile error summaries and application health digests
Example Use Cases
- Generate daily error summaries for the engineering team
- Identify top recurring exceptions for bug prioritization
- Monitor error rates after deployments and flag regressions
- Compile incident reports for post-mortems