

Overview
How It Works
This workspace automation executes according to your configured schedule (typically every weekday morning) and follows a structured execution pipeline:Spawn Scheduled Task
At the configured execution time, Zenflow launches a standalone task titled
Run Engineering Manager Dashboard using the Auto workflow.Locate and Verify Skill
The agent searches for the globally installed
engineering-manager skill across standard agent execution paths on the host machine.Automatic Installation
If the skill is not found, the agent automatically installs it globally using the Zencoder package registry, ensuring zero-configuration execution.
How to Install & Configure
Setting up the Engineering Manager Dashboard is straightforward. You can configure it from scratch or initialize it using the pre-built template in Zenflow.Quick Start with Templates
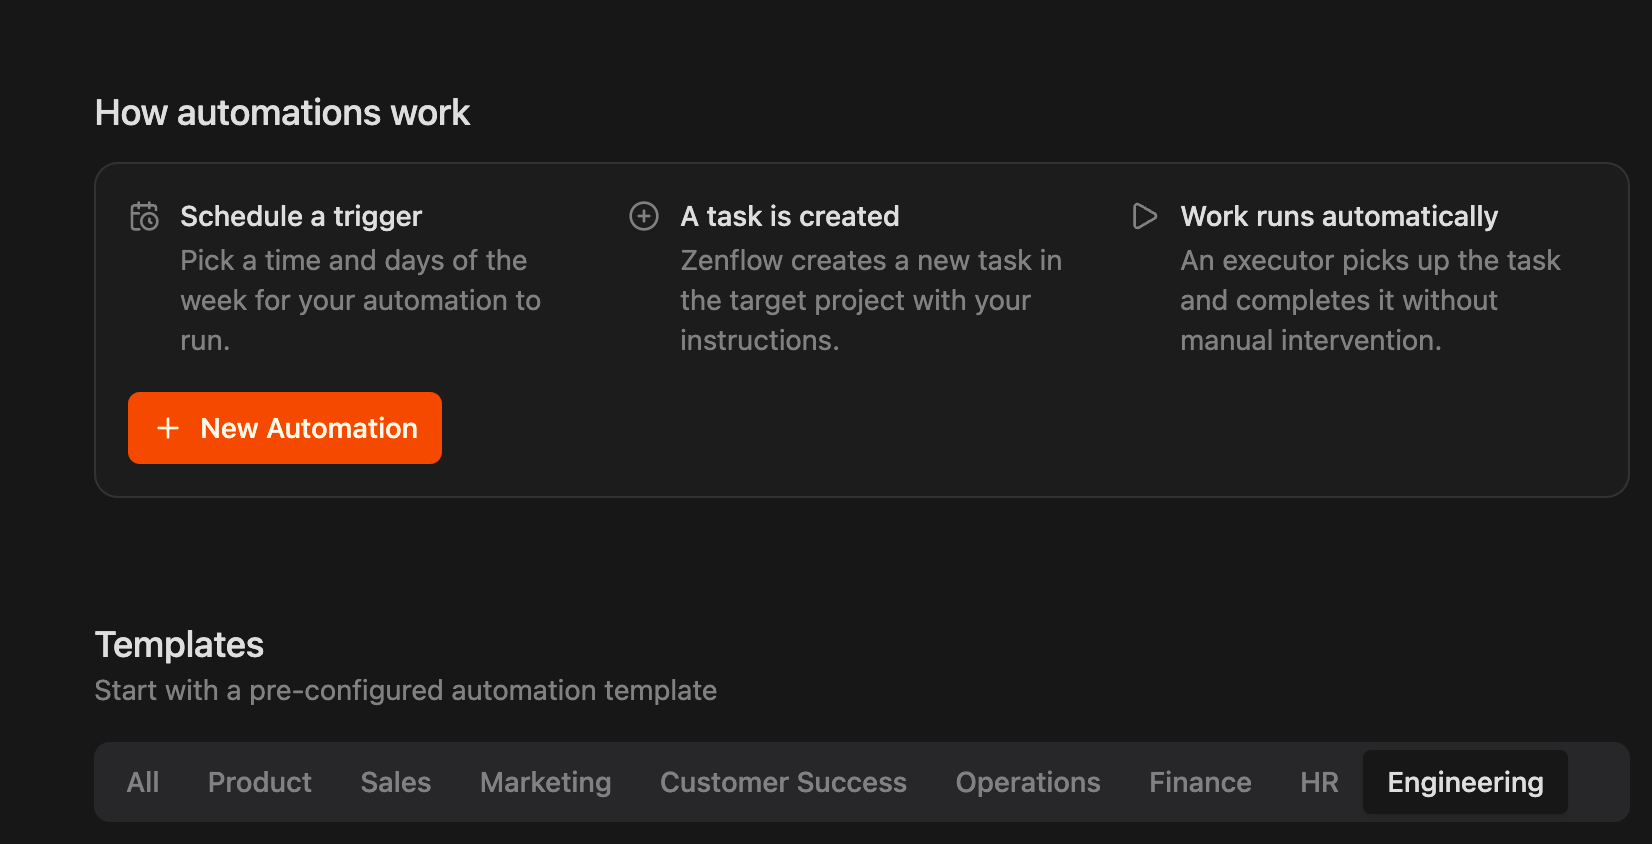
- Open Zenflow and click the thunderbolt icon in the left sidebar to navigate to the Automations view.
- Scroll to the Templates section at the bottom of the page and click the Engineering tab.
- Locate the Engineering Manager Dashboard card.
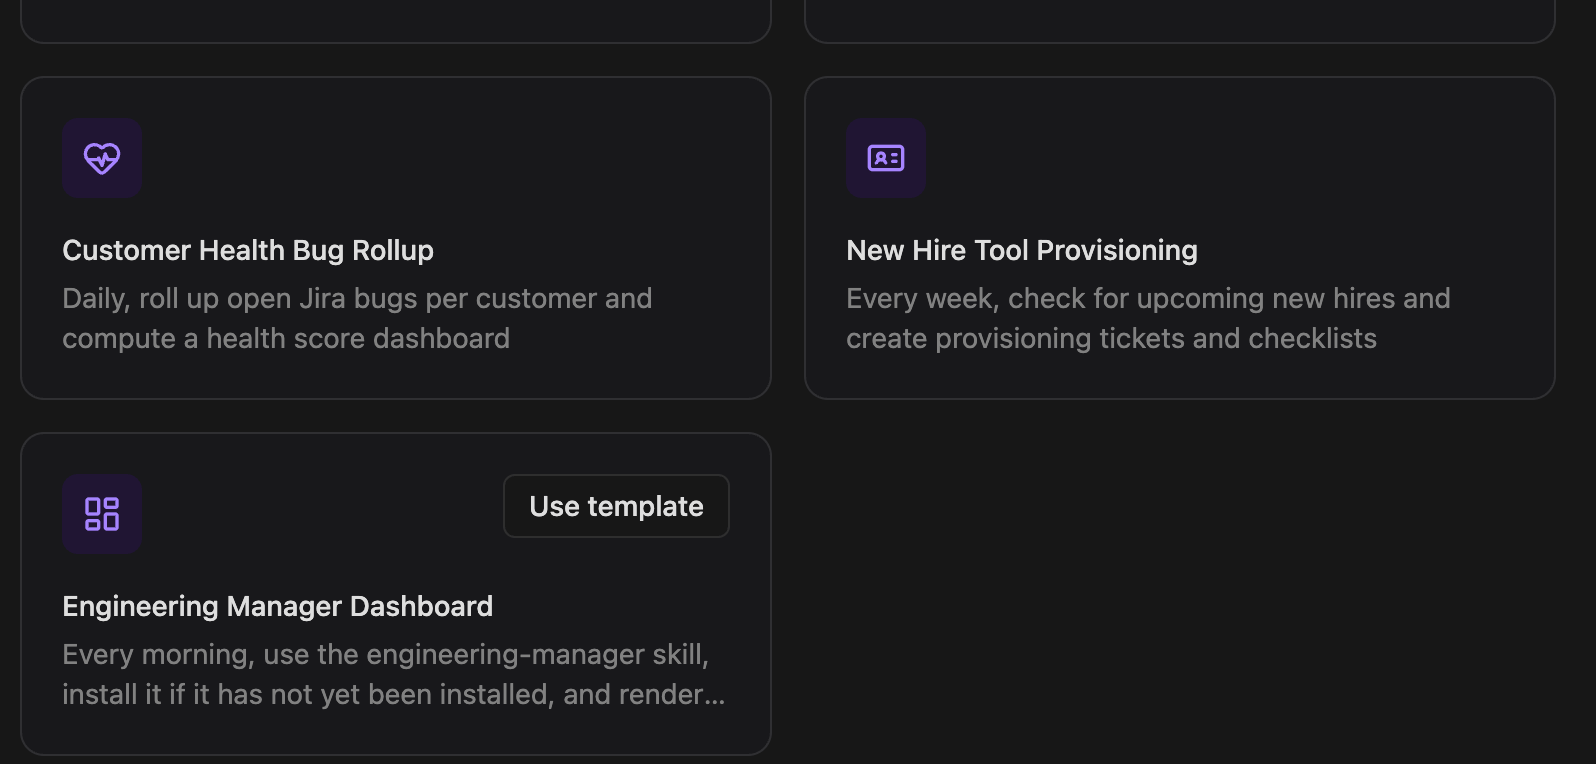
- Click Use template.
- Customize the schedule, target workspace, and execution settings in the modal dialog, and click Create.
Custom Installation Details
When creating or modifying the automation, the underlying execution flow is configured as follows: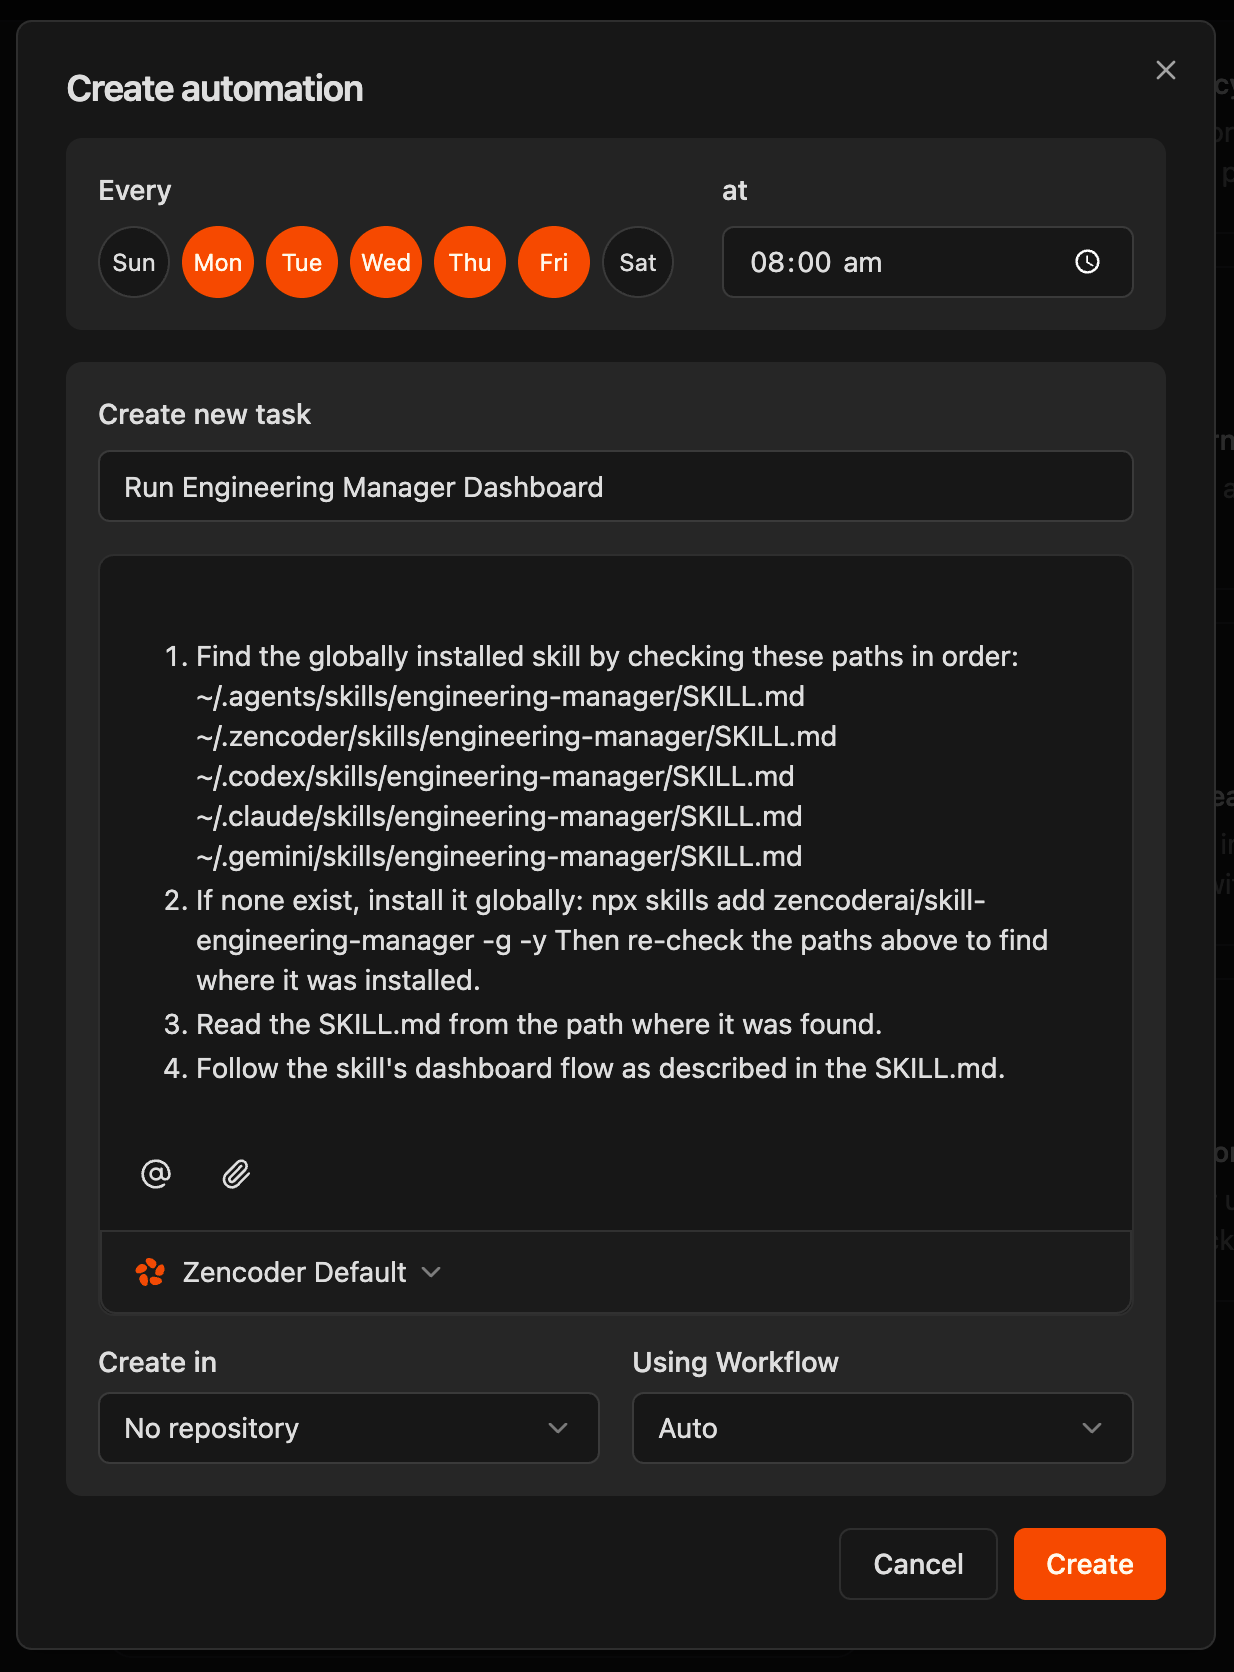
1. Skill Path Verification
1. Skill Path Verification
The agent checks for a globally installed skill by verifying the following local paths in order:
~/.agents/skills/engineering-manager/SKILL.md~/.zencoder/skills/engineering-manager/SKILL.md~/.codex/skills/engineering-manager/SKILL.md~/.claude/skills/engineering-manager/SKILL.md~/.gemini/skills/engineering-manager/SKILL.md
2. Missing Skill Installation
2. Missing Skill Installation
If the skill is not present in any of the checked paths, the agent automatically triggers a global installation:Once the command completes, the agent re-scans the directories to locate the newly installed
SKILL.md file.3. Load Skill Specification
3. Load Skill Specification
The agent reads and parses the
SKILL.md file from the identified path to initialize the specialized prompts, workflows, and execution context.4. Execute Dashboard Flow
4. Execute Dashboard Flow
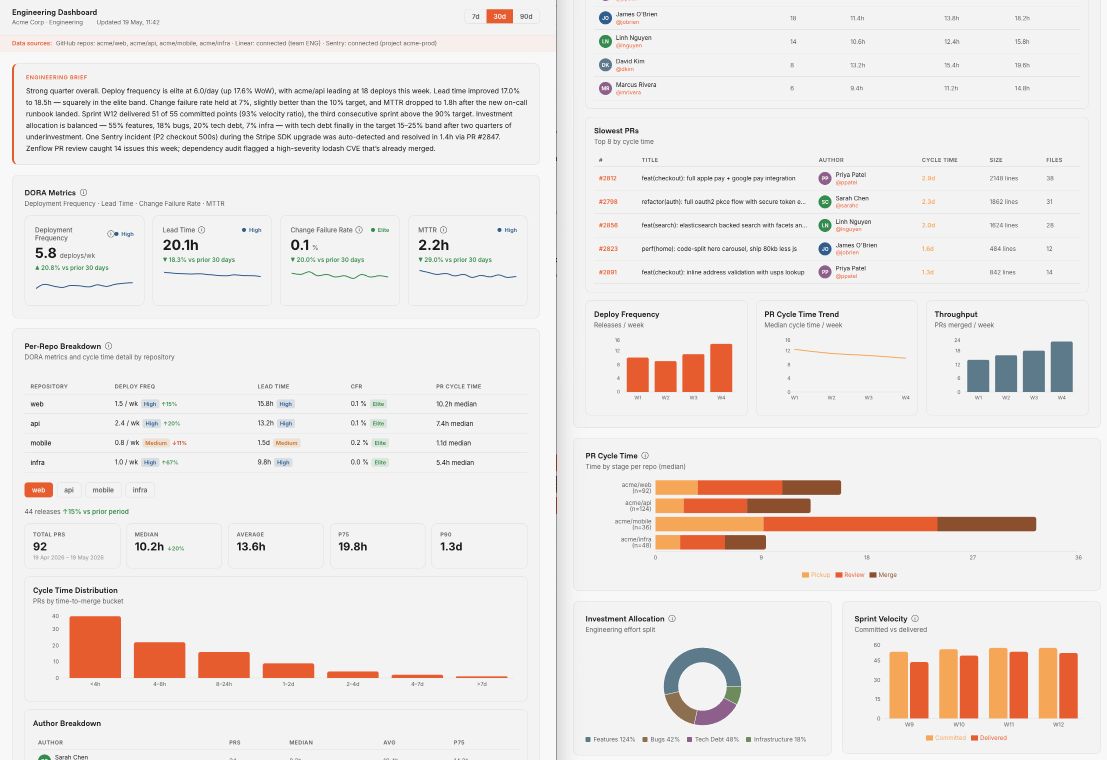
The agent executes the dashboard generation sequence outlined in the skill, compiling:
- PR Health: Analysis of open pull requests, review cycle times, and staleness
- Sprint Pulse: Updates on active sprint progress from Linear or Jira
- DORA Metrics: Investment allocation and deployment frequency
- Sentry Alerts: Unresolved critical production exceptions
Recommended Configuration
For the best results, we recommend setting up the automation with the following default parameters:| Configuration Field | Recommended Setting |
|---|---|
| Schedule | Weekdays (Mon, Tue, Wed, Thu, Fri) at 08:00 am |
| Task Name | Run Engineering Manager Dashboard |
| Repository | No repository (Runs standalone to aggregate multiple external platforms) |
| Using Workflow | Auto |
| Agent Model | Zencoder Default |