- Add a repository to Zenflow
- Run an agent task with a built-in workflow
- Review and merge the output
Prerequisite: Ensure you have installed and signed into Zenflow before starting this quickstart.
Step 1: Onboarding
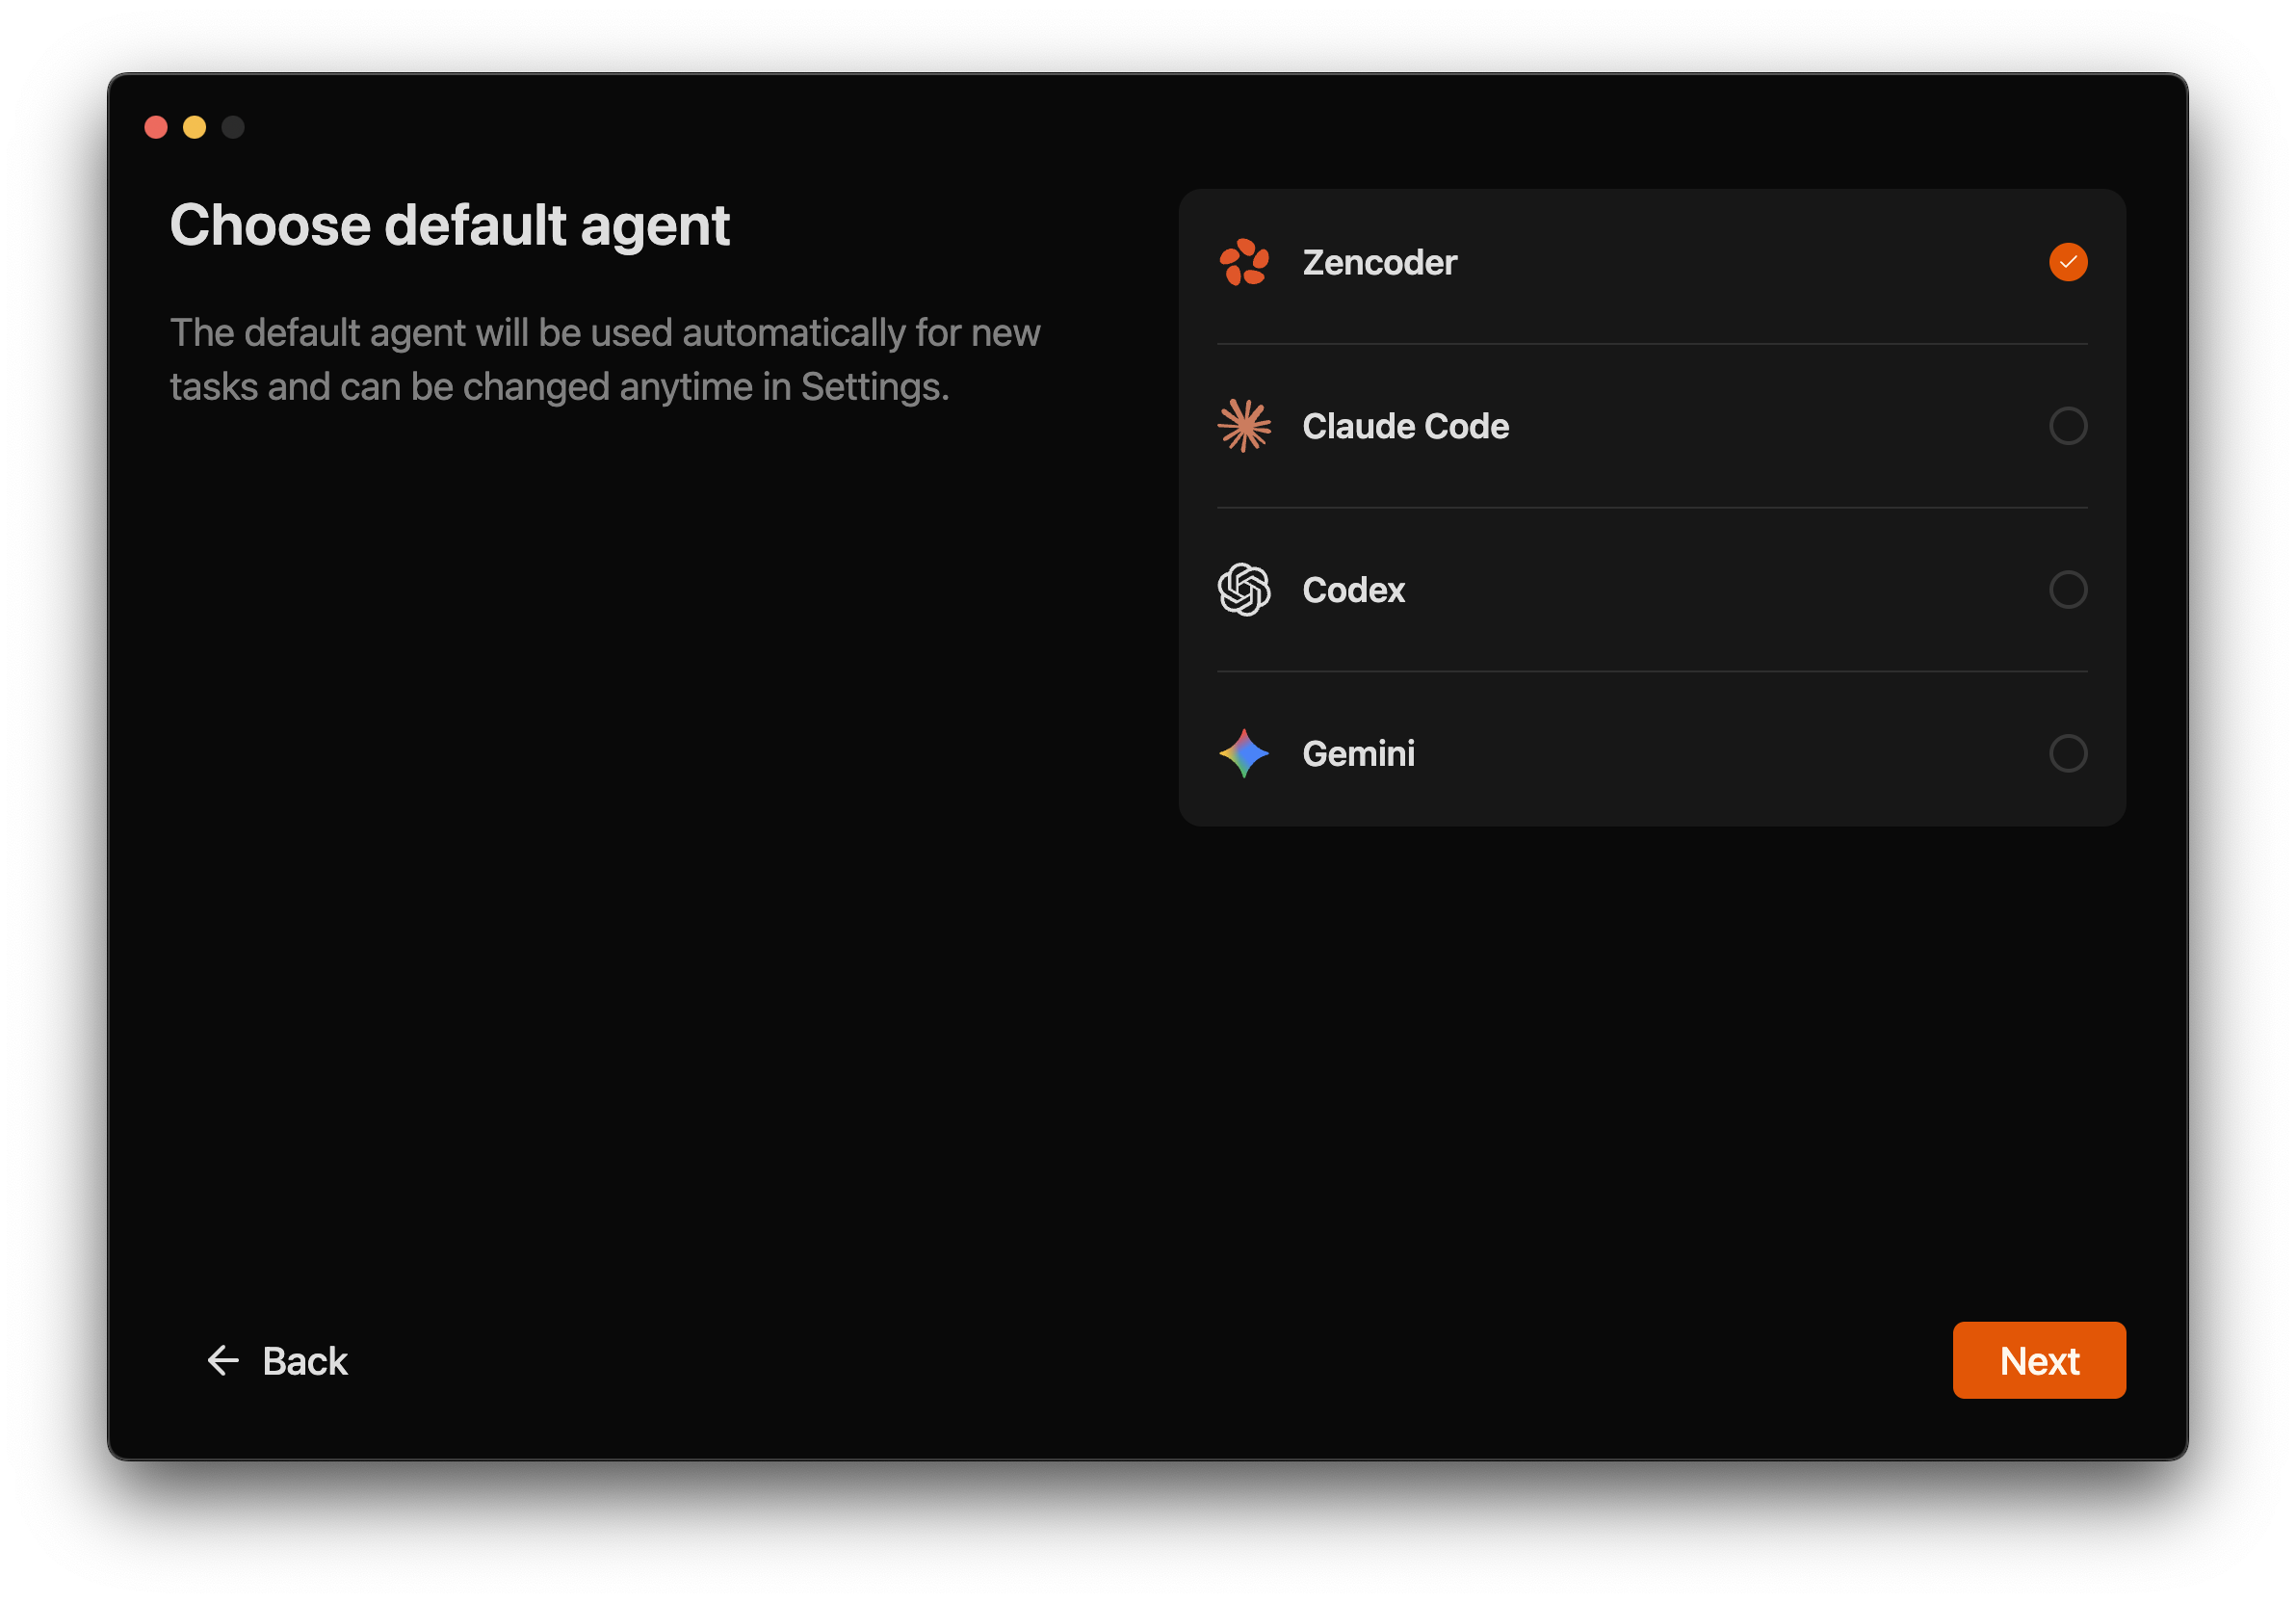
On first launch, Zenflow walks you through initial setup:Pick a default agent
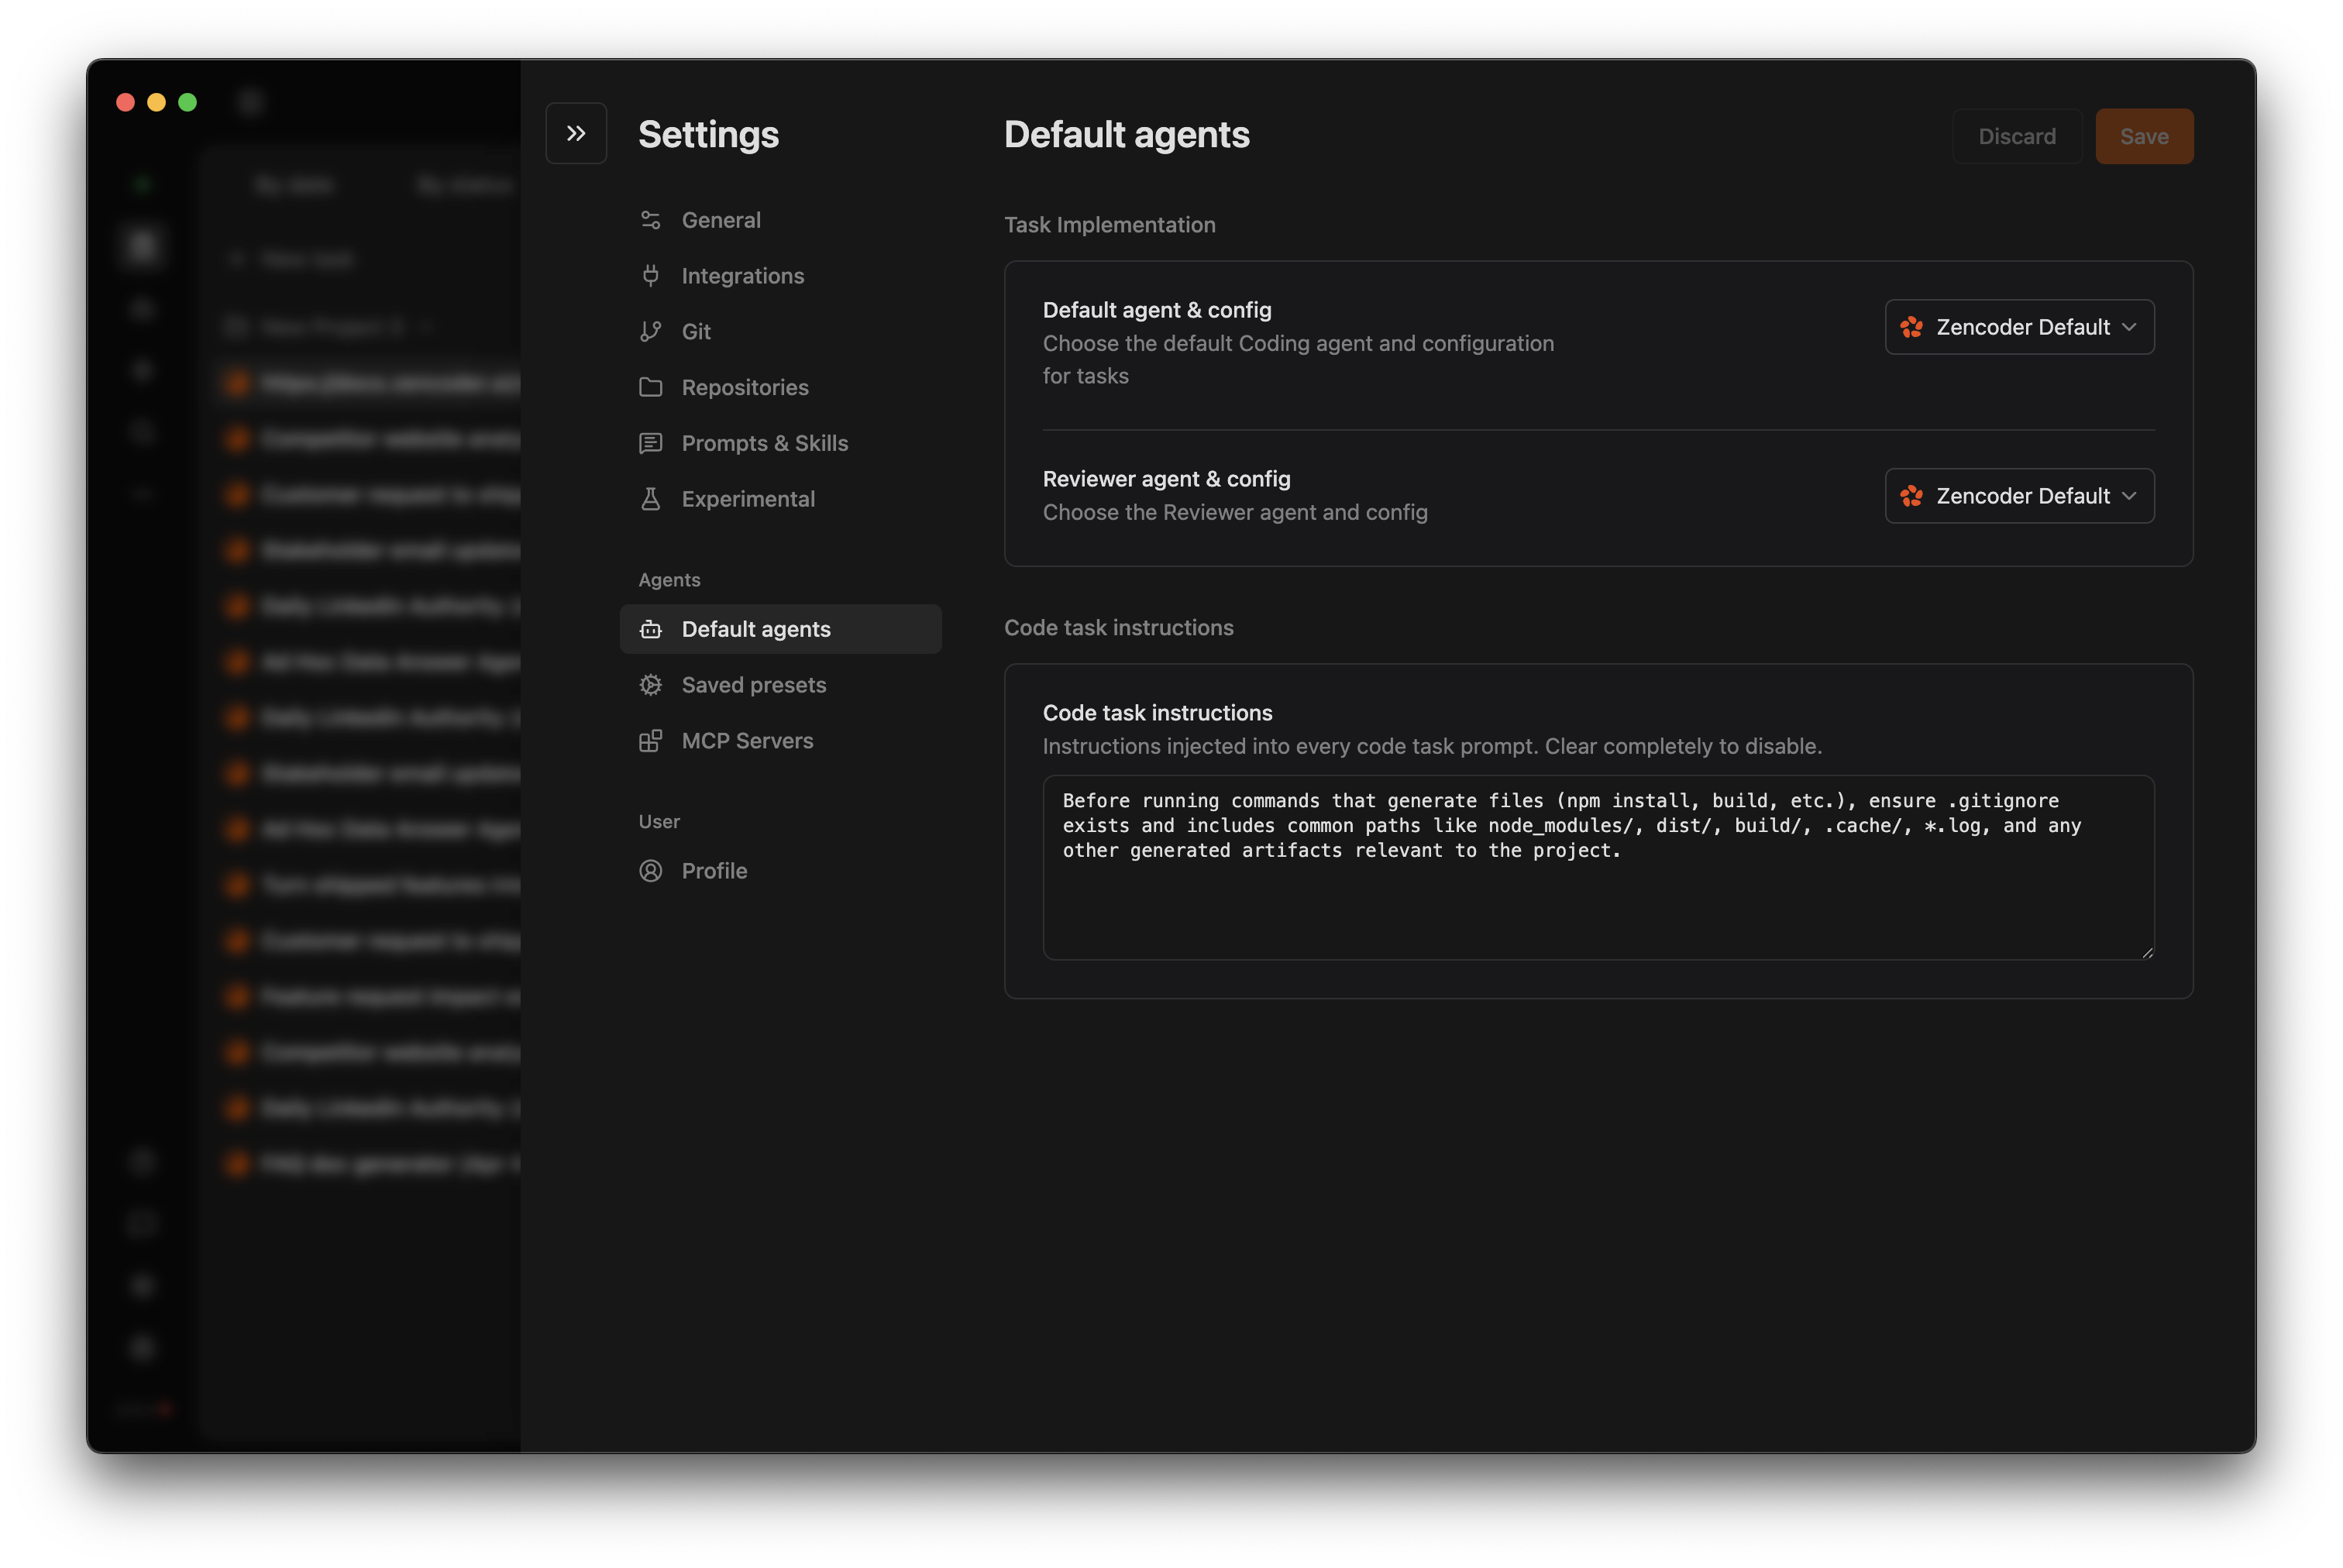
Choose between Zencoder, Claude Code, Codex, or Gemini as your default co-pilot. You can switch this preference anytime in Settings → Saved presets.
Zenflow validates your setup
After you select an agent, Zenflow checks whether its CLI or desktop integration is already installed locally. If something is missing, you get guided installation instructions so the agent can run reliably.
Step 2: Create Your First Task
Create a Task (2 minutes)
Start with a concise, outcome-based task description. Examples:Focus on what needs to happen, not how to code it.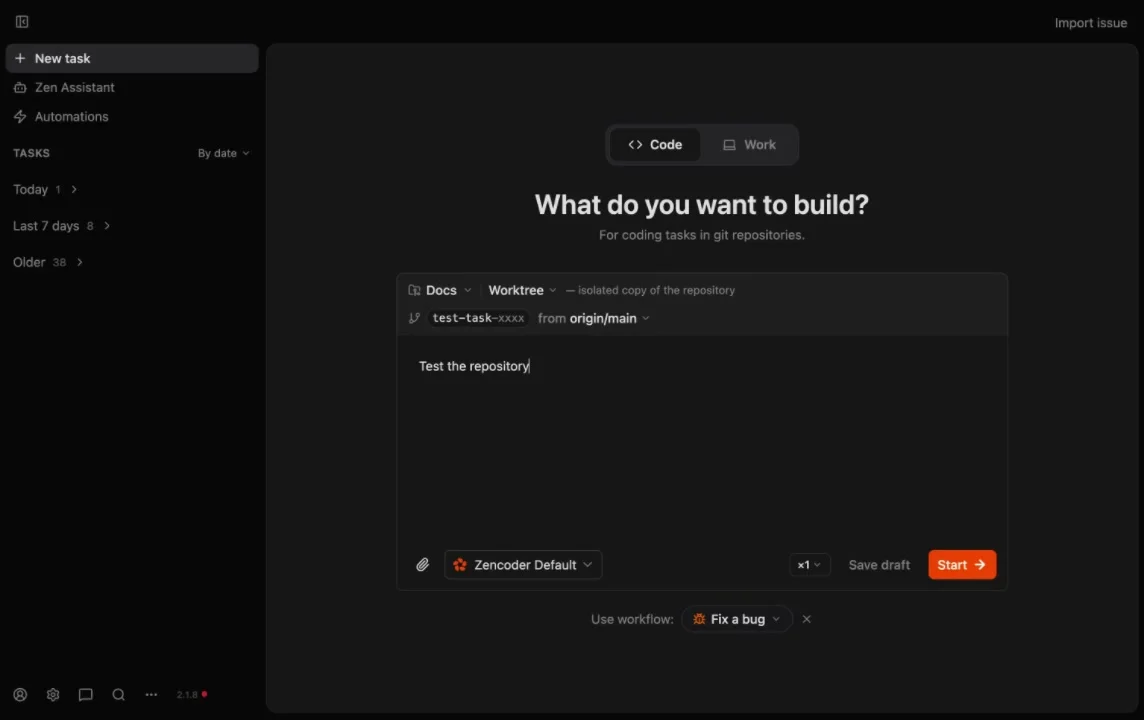
Pick a Workflow (2 minutes)
Choose how Zenflow should execute the work:
- Auto — agent decides the approach (best for most tasks)
- Fix a Bug — structured investigation → solution → implementation
- Spec First — technical spec before coding
- Requirements First — full PRD → spec → staged implementation
- Multi-model — different models for planning, implementation, review
- Custom — your own workflow definitions
Verify & Ship (3–6 minutes)
If you configured a verification script, Zenflow runs it after each agent turn (linting, type checks, tests). Review the Changes tab, then merge.
Next Steps
Key Concepts
Understand repositories, tasks, and workflows
Workflows
Explore built-in and custom workflows
Multi-Agent Orchestration
Multi-model pipelines and parallel review
Repository Configuration
Set up verification scripts and presets

Plans & Pricing
Subscription tiers and billing
Supported Agents
Zencoder, Claude Code, Codex, Gemini, and custom agents