> ## Documentation Index
> Fetch the complete documentation index at: https://docs.zencoder.ai/llms.txt
> Use this file to discover all available pages before exploring further.
# Sentry
> Connect Zenflow Work to Sentry to access error monitoring, incident tracking, and application health data.
This native integration requires a Zencoder account.
## Overview
The Sentry integration gives the AI agent access to your error monitoring and incident data. Track exceptions, monitor application health, surface recurring issues, and generate incident reports — all from within a Zenflow task.
Sentry integration is based on [Sentry MCP](https://docs.sentry.io/ai/mcp/)
## Connecting Sentry
Navigate to **Settings → Integrations** in the Zenflow sidebar.
Locate **Sentry** in the Integrations Catalog.
Click the **Connect** or **\[+]** button on the Sentry card.
Authenticate and authorize Zenflow to access your Sentry workspace via the secure OAuth popup window:
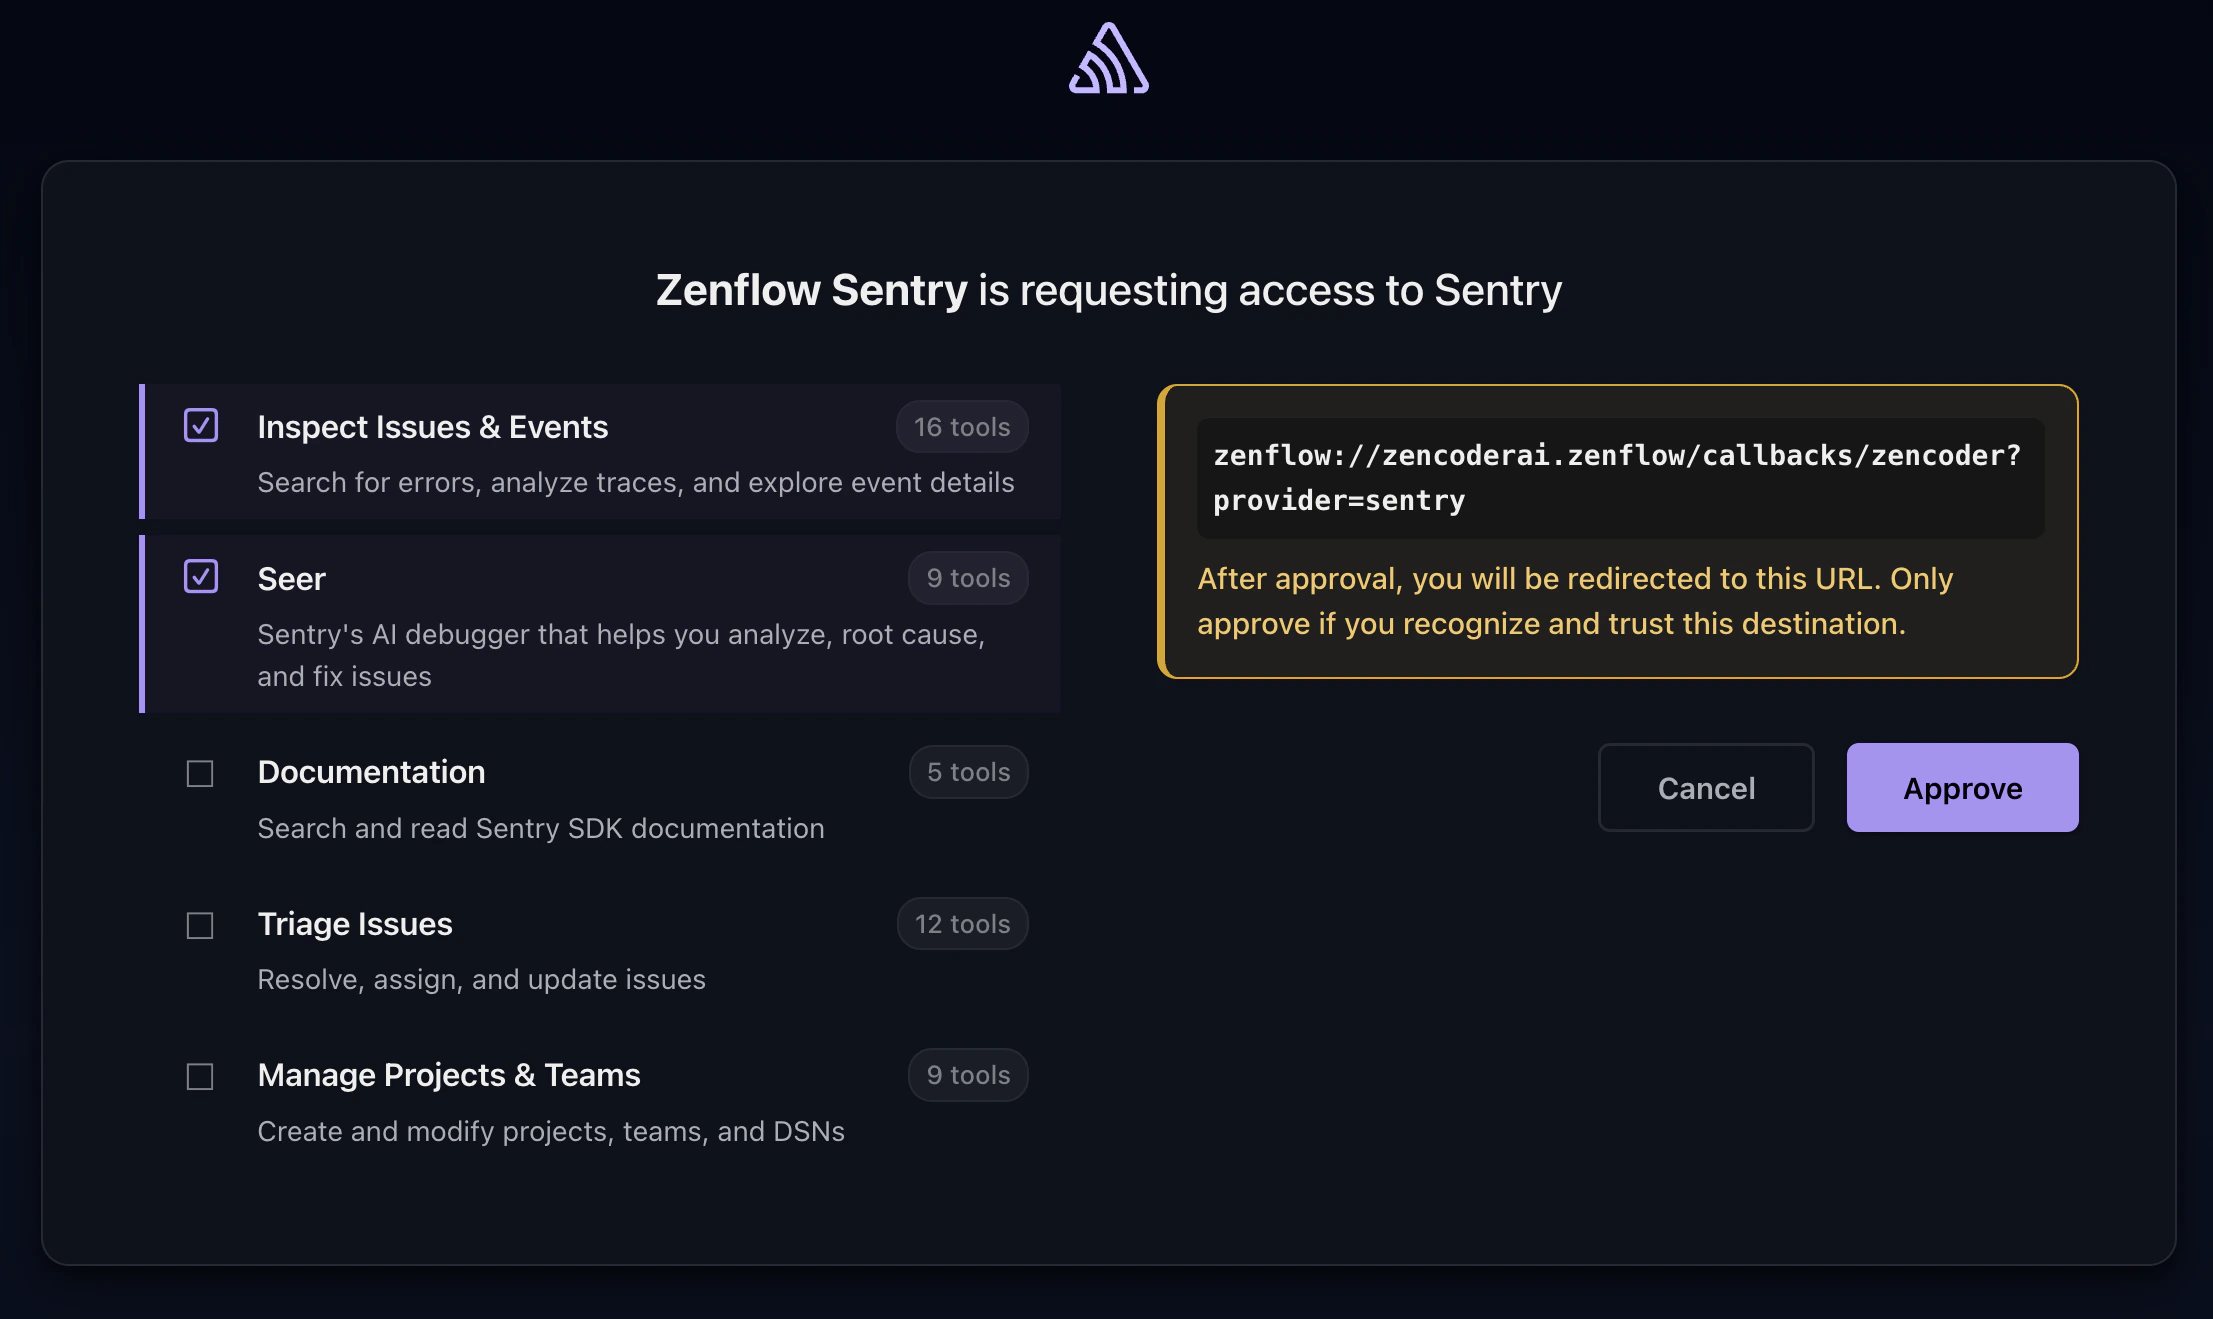
Select desired scopes, click **Approve**
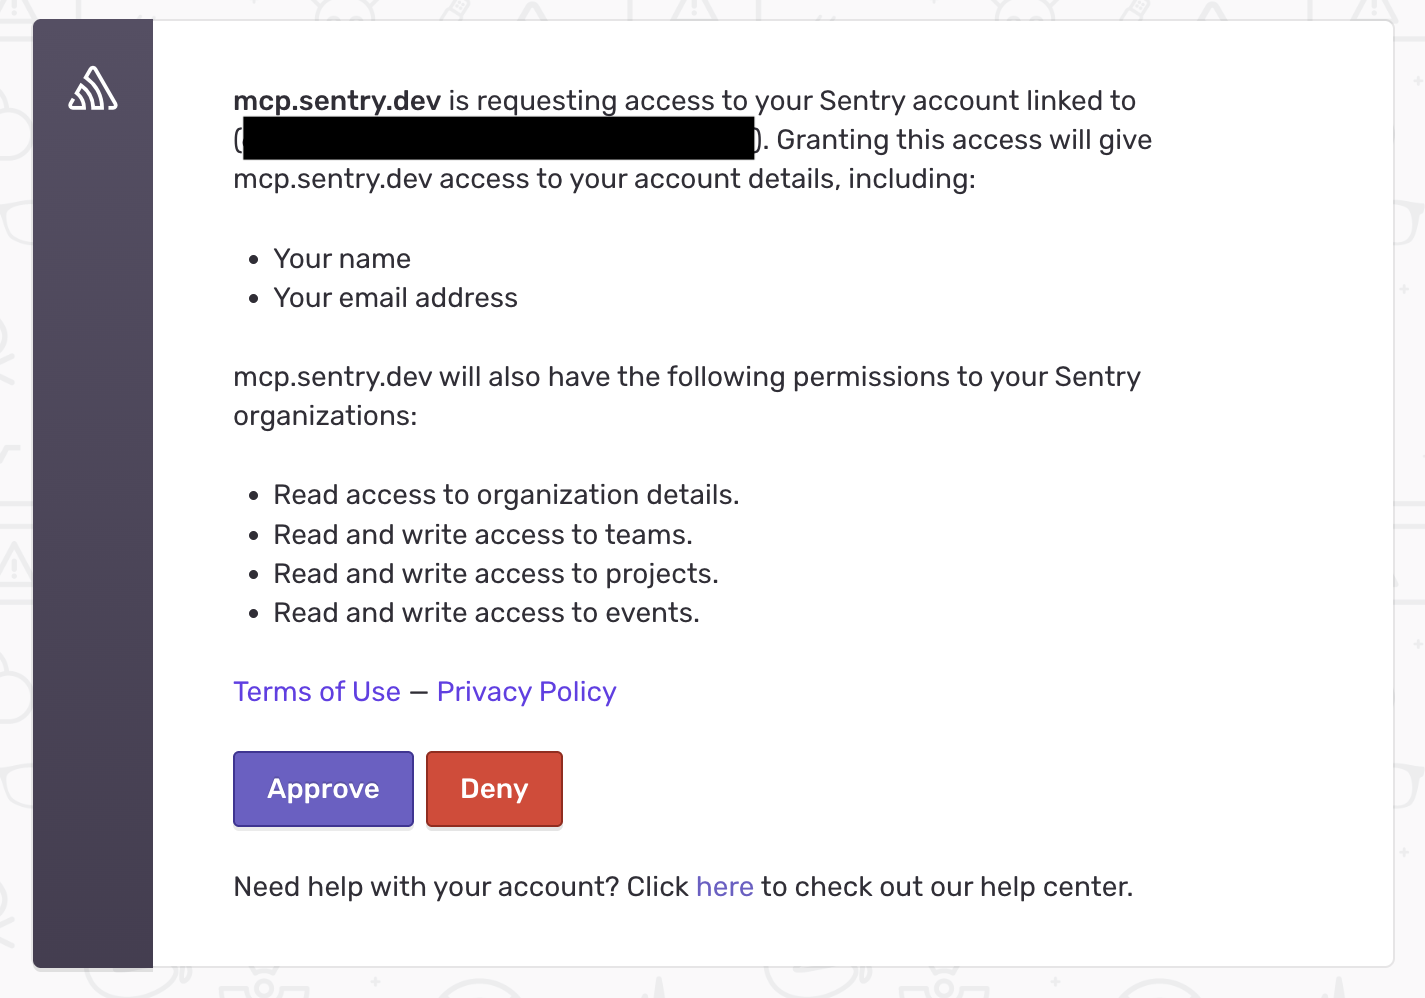
 On the next screen, verify the permissions and click **Approve**
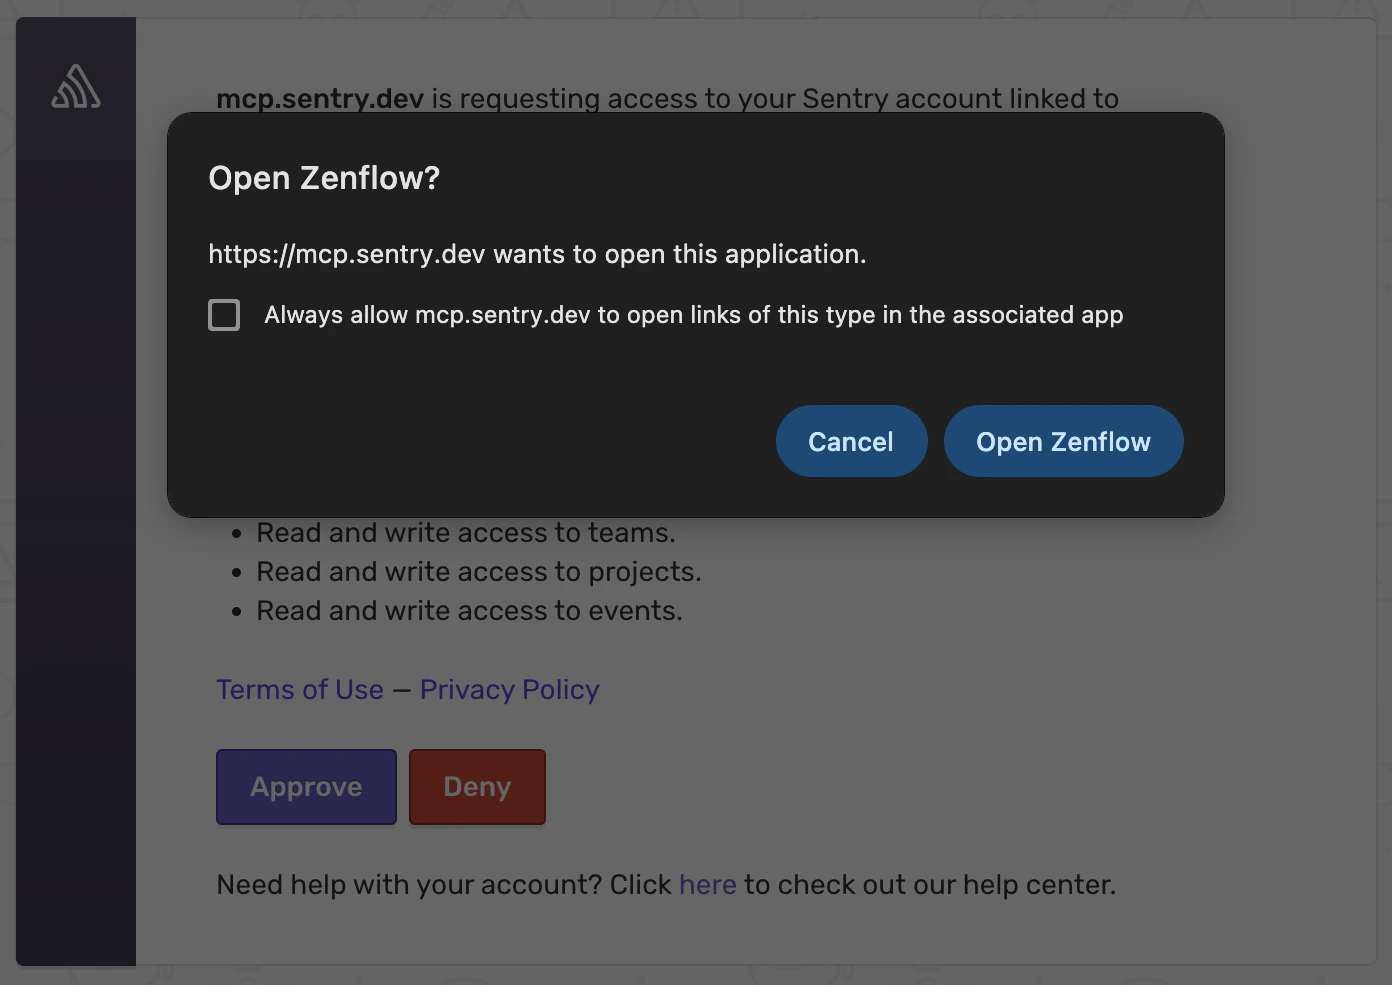
 You should get a modal asking if you want to open Zenflow, click **Open Zenflow**
 ## What the Agent Can Do
* **Monitor errors** — Access exception data, stack traces, and error frequency
* **Track incidents** — View active incidents, their status, and resolution history
* **Surface trends** — Identify recurring issues and regression patterns
* **Generate reports** — Compile error summaries and application health digests
## Example Use Cases
* Generate daily error summaries for the engineering team
* Identify top recurring exceptions for bug prioritization
* Monitor error rates after deployments and flag regressions
* Compile incident reports for post-mortems
Browse ready-to-use templates in the **[Zencoder Marketplace](https://zencoder.ai/marketplace)**.
## What the Agent Can Do
* **Monitor errors** — Access exception data, stack traces, and error frequency
* **Track incidents** — View active incidents, their status, and resolution history
* **Surface trends** — Identify recurring issues and regression patterns
* **Generate reports** — Compile error summaries and application health digests
## Example Use Cases
* Generate daily error summaries for the engineering team
* Identify top recurring exceptions for bug prioritization
* Monitor error rates after deployments and flag regressions
* Compile incident reports for post-mortems
Browse ready-to-use templates in the **[Zencoder Marketplace](https://zencoder.ai/marketplace)**.