> ## Documentation Index
> Fetch the complete documentation index at: https://docs.zencoder.ai/llms.txt
> Use this file to discover all available pages before exploring further.
# Getting Debug Information
> Learn how to gather and share debug information to help us troubleshoot issues with Zencoder more effectively.
## Intro
This guide will help you collect and share important debug information when encountering issues with Zencoder. By providing specific details about your problem, you can help our support team diagnose and resolve your issues much faster. This guide covers how to:
* Share Operation IDs for specific requests
* Enable debug information in your IDE
* Access and share logs and outputs
## Helping Us Help You
Even the best software experiences issues occasionally. When problems occur with Zencoder, providing specific information about your issue helps us resolve it quickly and effectively. There are several ways you can help us diagnose problems.
### Sharing Operation IDs
Each request to Zencoder is assigned a unique Operation ID. This identifier helps our team trace exactly what happened during your interaction with the system, making it much easier to diagnose problems.
#### Enabling Debug Information in VS Code
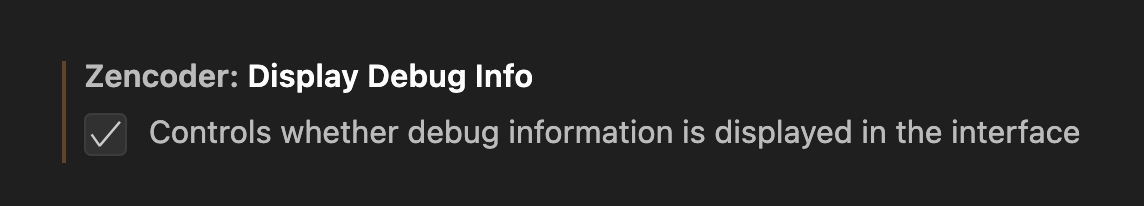
To view Operation IDs in VS Code:
1. Go to `Settings` (`File > Preferences > Settings` or press `Ctrl+,` / `Cmd+,`)
2. Search for `Zencoder: Display debug info`
3. Check the box labeled `Controls whether debug information is displayed in the interface`
 Once enabled, you'll see Operation IDs displayed in the Zencoder interface when you make requests:
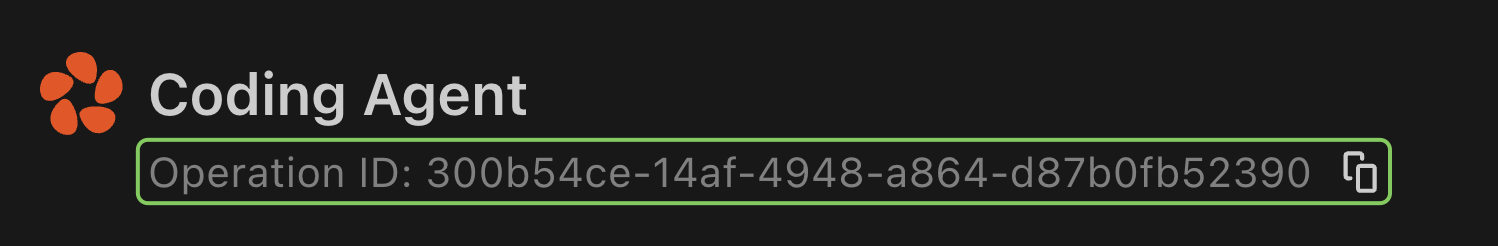 When reporting an issue, please copy and paste this Operation ID along with any error messages you received (screenshots are helpful).
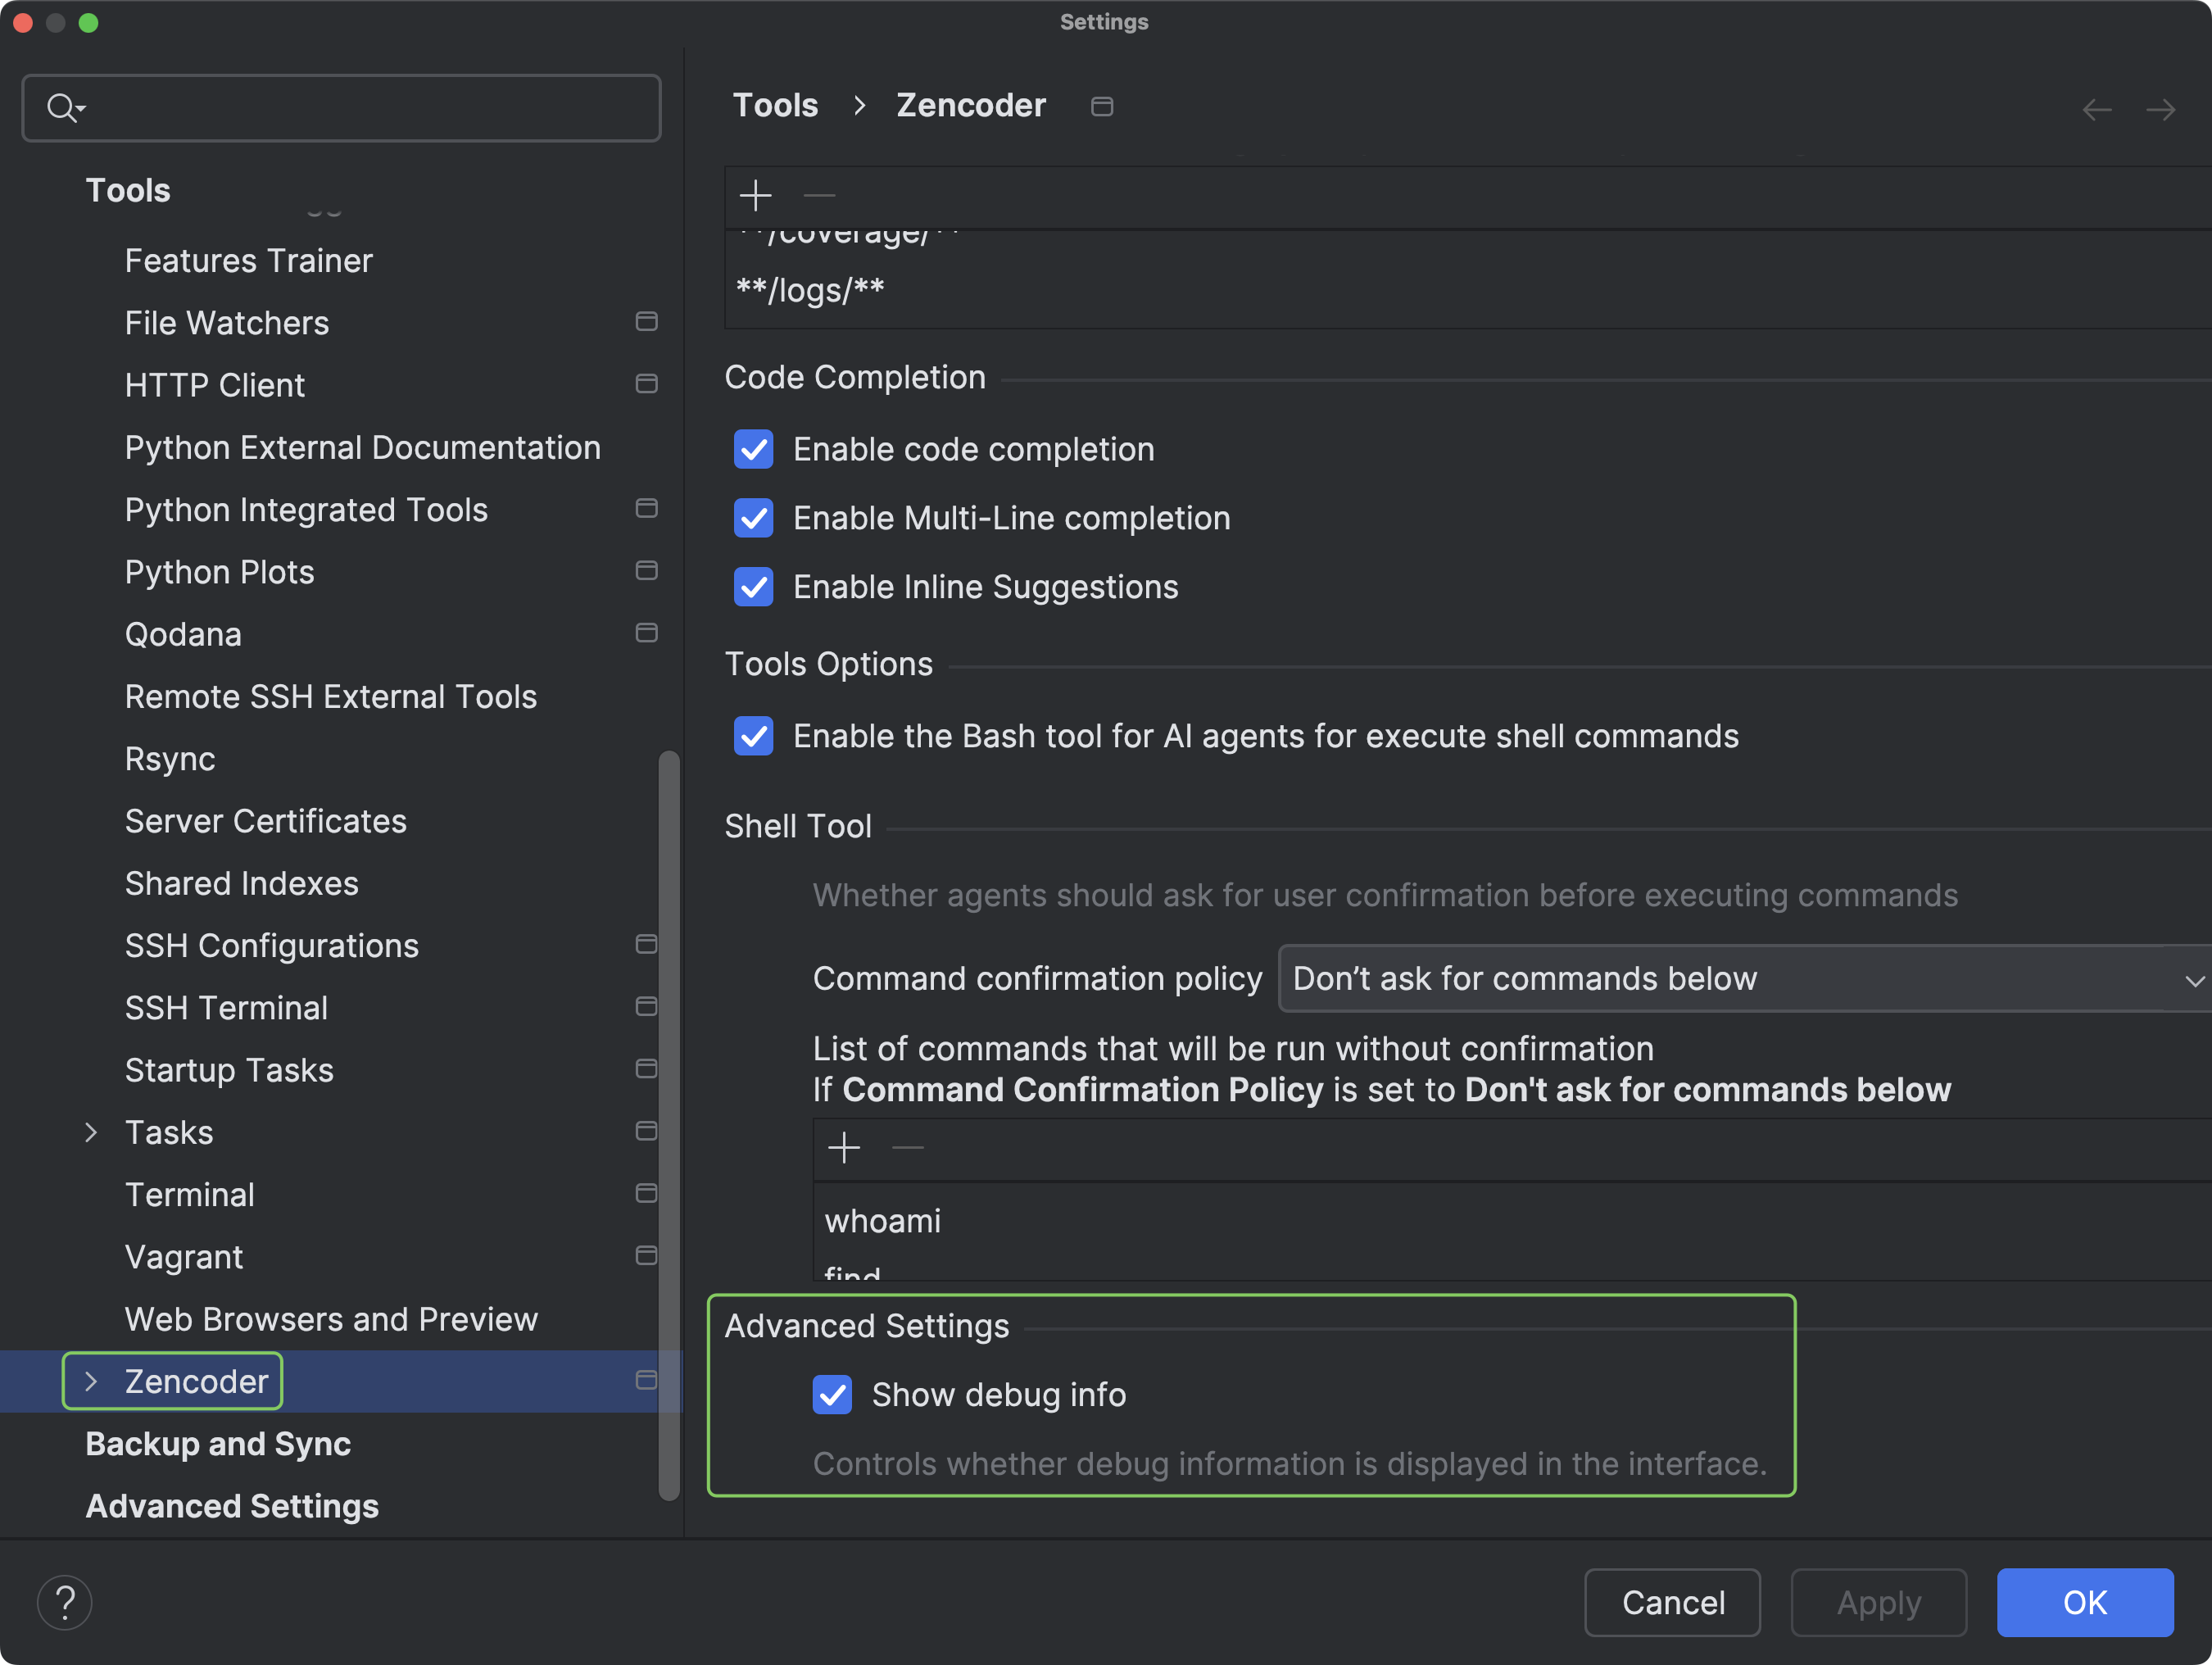
#### Enabling Debug Information in JetBrains IDEs
To view Operation IDs in JetBrains products (IntelliJ IDEA, PyCharm, WebStorm, etc.):
1. Go to `Settings/Preferences` (`File > Settings` or press `Ctrl+Alt+S` / `Cmd+,`)
2. Navigate to `Tools > Zencoder`
3. Scroll down to `Advanced Settings`
4. Check the `Show debug info` checkbox
When reporting an issue, please copy and paste this Operation ID along with any error messages you received (screenshots are helpful).
#### Enabling Debug Information in JetBrains IDEs
To view Operation IDs in JetBrains products (IntelliJ IDEA, PyCharm, WebStorm, etc.):
1. Go to `Settings/Preferences` (`File > Settings` or press `Ctrl+Alt+S` / `Cmd+,`)
2. Navigate to `Tools > Zencoder`
3. Scroll down to `Advanced Settings`
4. Check the `Show debug info` checkbox
 Once enabled, you'll see Operation IDs displayed in the Zencoder interface when you make requests:
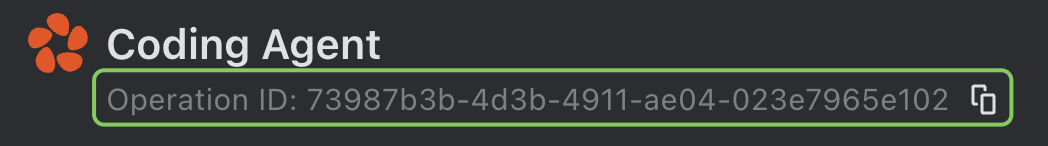 When reporting an issue, please copy and paste this Operation ID along with any error messages you received (screenshots are helpful).
## Sharing Your Logs and Outputs
Log files and console outputs contain valuable information that can help us diagnose issues with Zencoder. Here's how to access and share these logs:
#### Accessing Zencoder Logs in VS Code
VS Code stores Zencoder-related logs in the Output panel:
1. Open the `Output` panel by pressing `Shift+Cmd+U` on Mac or `Ctrl+Shift+U` on Windows
2. From the dropdown menu in the top-right corner of the `Output` panel, select `Zencoder`
3. This will filter the output to show only Zencoder-related logs
When reporting an issue, please copy and paste this Operation ID along with any error messages you received (screenshots are helpful).
## Sharing Your Logs and Outputs
Log files and console outputs contain valuable information that can help us diagnose issues with Zencoder. Here's how to access and share these logs:
#### Accessing Zencoder Logs in VS Code
VS Code stores Zencoder-related logs in the Output panel:
1. Open the `Output` panel by pressing `Shift+Cmd+U` on Mac or `Ctrl+Shift+U` on Windows
2. From the dropdown menu in the top-right corner of the `Output` panel, select `Zencoder`
3. This will filter the output to show only Zencoder-related logs
 When reporting an issue, you can:
* Copy the relevant log entries from this panel
* Take a screenshot of the error messages
* Save the log content to a file by clicking in the `Output` panel and using `Ctrl/Cmd+A` to select all, then `Ctrl/Cmd+C` to copy
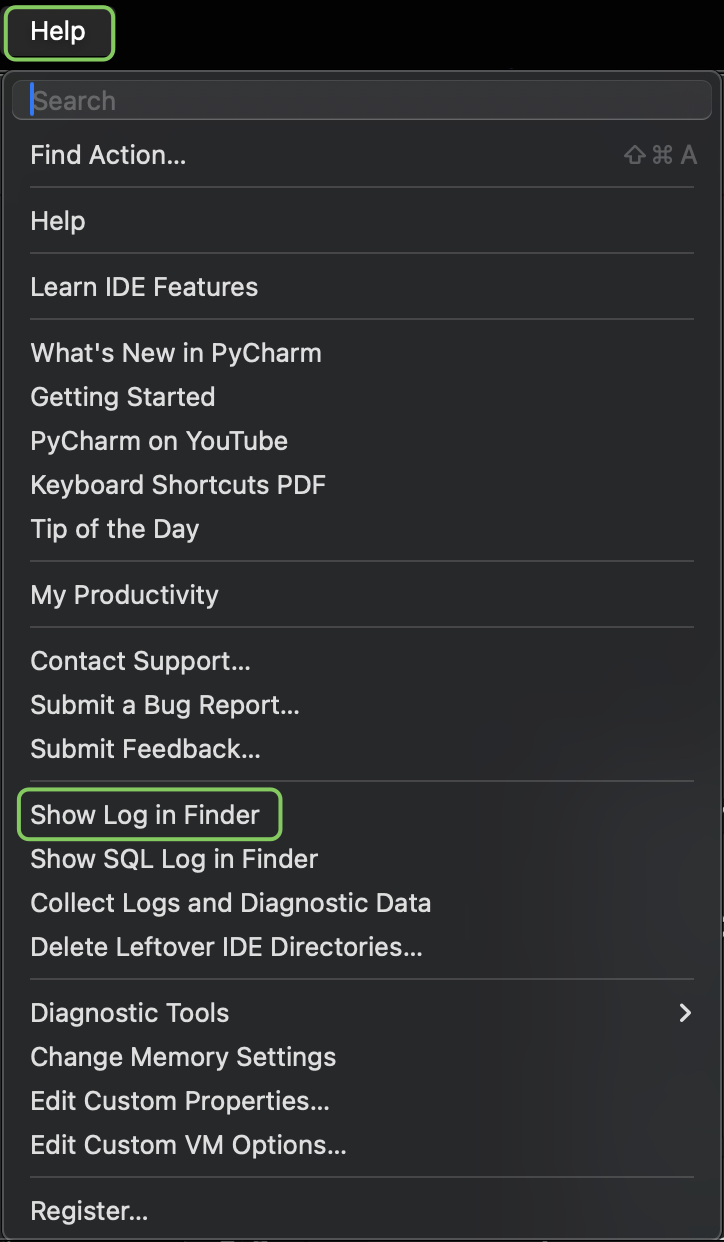
#### Accessing Zencoder Logs in JetBrains IDEs
JetBrains IDEs store logs in a dedicated log file:
1. Go to the main menu and select `Help`
2. Click on `Show Log in Finder` (on macOS) or `Show Log in Explorer` (on Windows)
3. This will open your file explorer with the log file (`idea.log`) selected
When reporting an issue, you can:
* Copy the relevant log entries from this panel
* Take a screenshot of the error messages
* Save the log content to a file by clicking in the `Output` panel and using `Ctrl/Cmd+A` to select all, then `Ctrl/Cmd+C` to copy
#### Accessing Zencoder Logs in JetBrains IDEs
JetBrains IDEs store logs in a dedicated log file:
1. Go to the main menu and select `Help`
2. Click on `Show Log in Finder` (on macOS) or `Show Log in Explorer` (on Windows)
3. This will open your file explorer with the log file (`idea.log`) selected
 When reporting an issue, please attach this `idea.log` file to your bug report or support request. This file contains detailed information that will help us diagnose the problem more effectively.
## Additional Debugging Tips
When sharing logs or screenshots, try to:
1. Reproduce the issue right before capturing the logs to ensure the relevant information is included
2. Include any error messages you see in the UI
3. Describe the steps you took that led to the issue
4. Mention your operating system and IDE version
5. Share which version of Zencoder you're using (this can be found in the extension settings)
### Screen Recordings
Screen recordings can be extremely helpful for our team to understand complex issues. Consider sharing:
* A short video recording using tools like [Loom](https://www.loom.com) or any screen recorder
* A recording that shows the steps to reproduce the issue
* Your narration explaining what you're experiencing as you demonstrate the problem
### Sharing Contact Information
When reporting issues:
* If possible, include the email address associated with your Zencoder account so we can locate your information in our system
* When sharing in public channels like Reddit or Discord, be mindful of private data
* For sensitive information, consider using direct messages to Zencoder team members or email support
## Getting Additional Help
For more information about how to get support or provide feedback, please visit our [Community Support page](/get-started/community-support). Our team is committed to helping you resolve any issues you encounter with Zencoder.
When reporting an issue, please attach this `idea.log` file to your bug report or support request. This file contains detailed information that will help us diagnose the problem more effectively.
## Additional Debugging Tips
When sharing logs or screenshots, try to:
1. Reproduce the issue right before capturing the logs to ensure the relevant information is included
2. Include any error messages you see in the UI
3. Describe the steps you took that led to the issue
4. Mention your operating system and IDE version
5. Share which version of Zencoder you're using (this can be found in the extension settings)
### Screen Recordings
Screen recordings can be extremely helpful for our team to understand complex issues. Consider sharing:
* A short video recording using tools like [Loom](https://www.loom.com) or any screen recorder
* A recording that shows the steps to reproduce the issue
* Your narration explaining what you're experiencing as you demonstrate the problem
### Sharing Contact Information
When reporting issues:
* If possible, include the email address associated with your Zencoder account so we can locate your information in our system
* When sharing in public channels like Reddit or Discord, be mindful of private data
* For sensitive information, consider using direct messages to Zencoder team members or email support
## Getting Additional Help
For more information about how to get support or provide feedback, please visit our [Community Support page](/get-started/community-support). Our team is committed to helping you resolve any issues you encounter with Zencoder.