> ## Documentation Index
> Fetch the complete documentation index at: https://docs.zencoder.ai/llms.txt
> Use this file to discover all available pages before exploring further.

# Analytics Dashboard

> Track usage patterns and monitor team engagement with Zencoder across your organization

## Overview

The Analytics dashboard shows daily usage data for your organization: active user counts, per-member activity, IDEs and languages used.

<Note>
  Analytics is available for users on [Pro Plus plans and above](/faq/pricing). Access requires **Owner or Manager** role permissions within your organization.
</Note>

## Accessing Analytics

Navigate to your [Analytics dashboard](https://auth.zencoder.ai/analytics) directly, or go to [auth.zencoder.ai](https://auth.zencoder.ai) and select `Analytics` from the sidebar navigation.

<img src="https://mintcdn.com/forgoodaiinc/NXH8pGxYpJ6zaJow/images/analytics.png?fit=max&auto=format&n=NXH8pGxYpJ6zaJow&q=85&s=170ac8911b7e8e043d5c6cc79fa3f95e" alt="Zencoder Analytics dashboard showing active users graph and member activity table with IDE and language usage data" width="3430" height="1848" data-path="images/analytics.png" />

## Dashboard Components
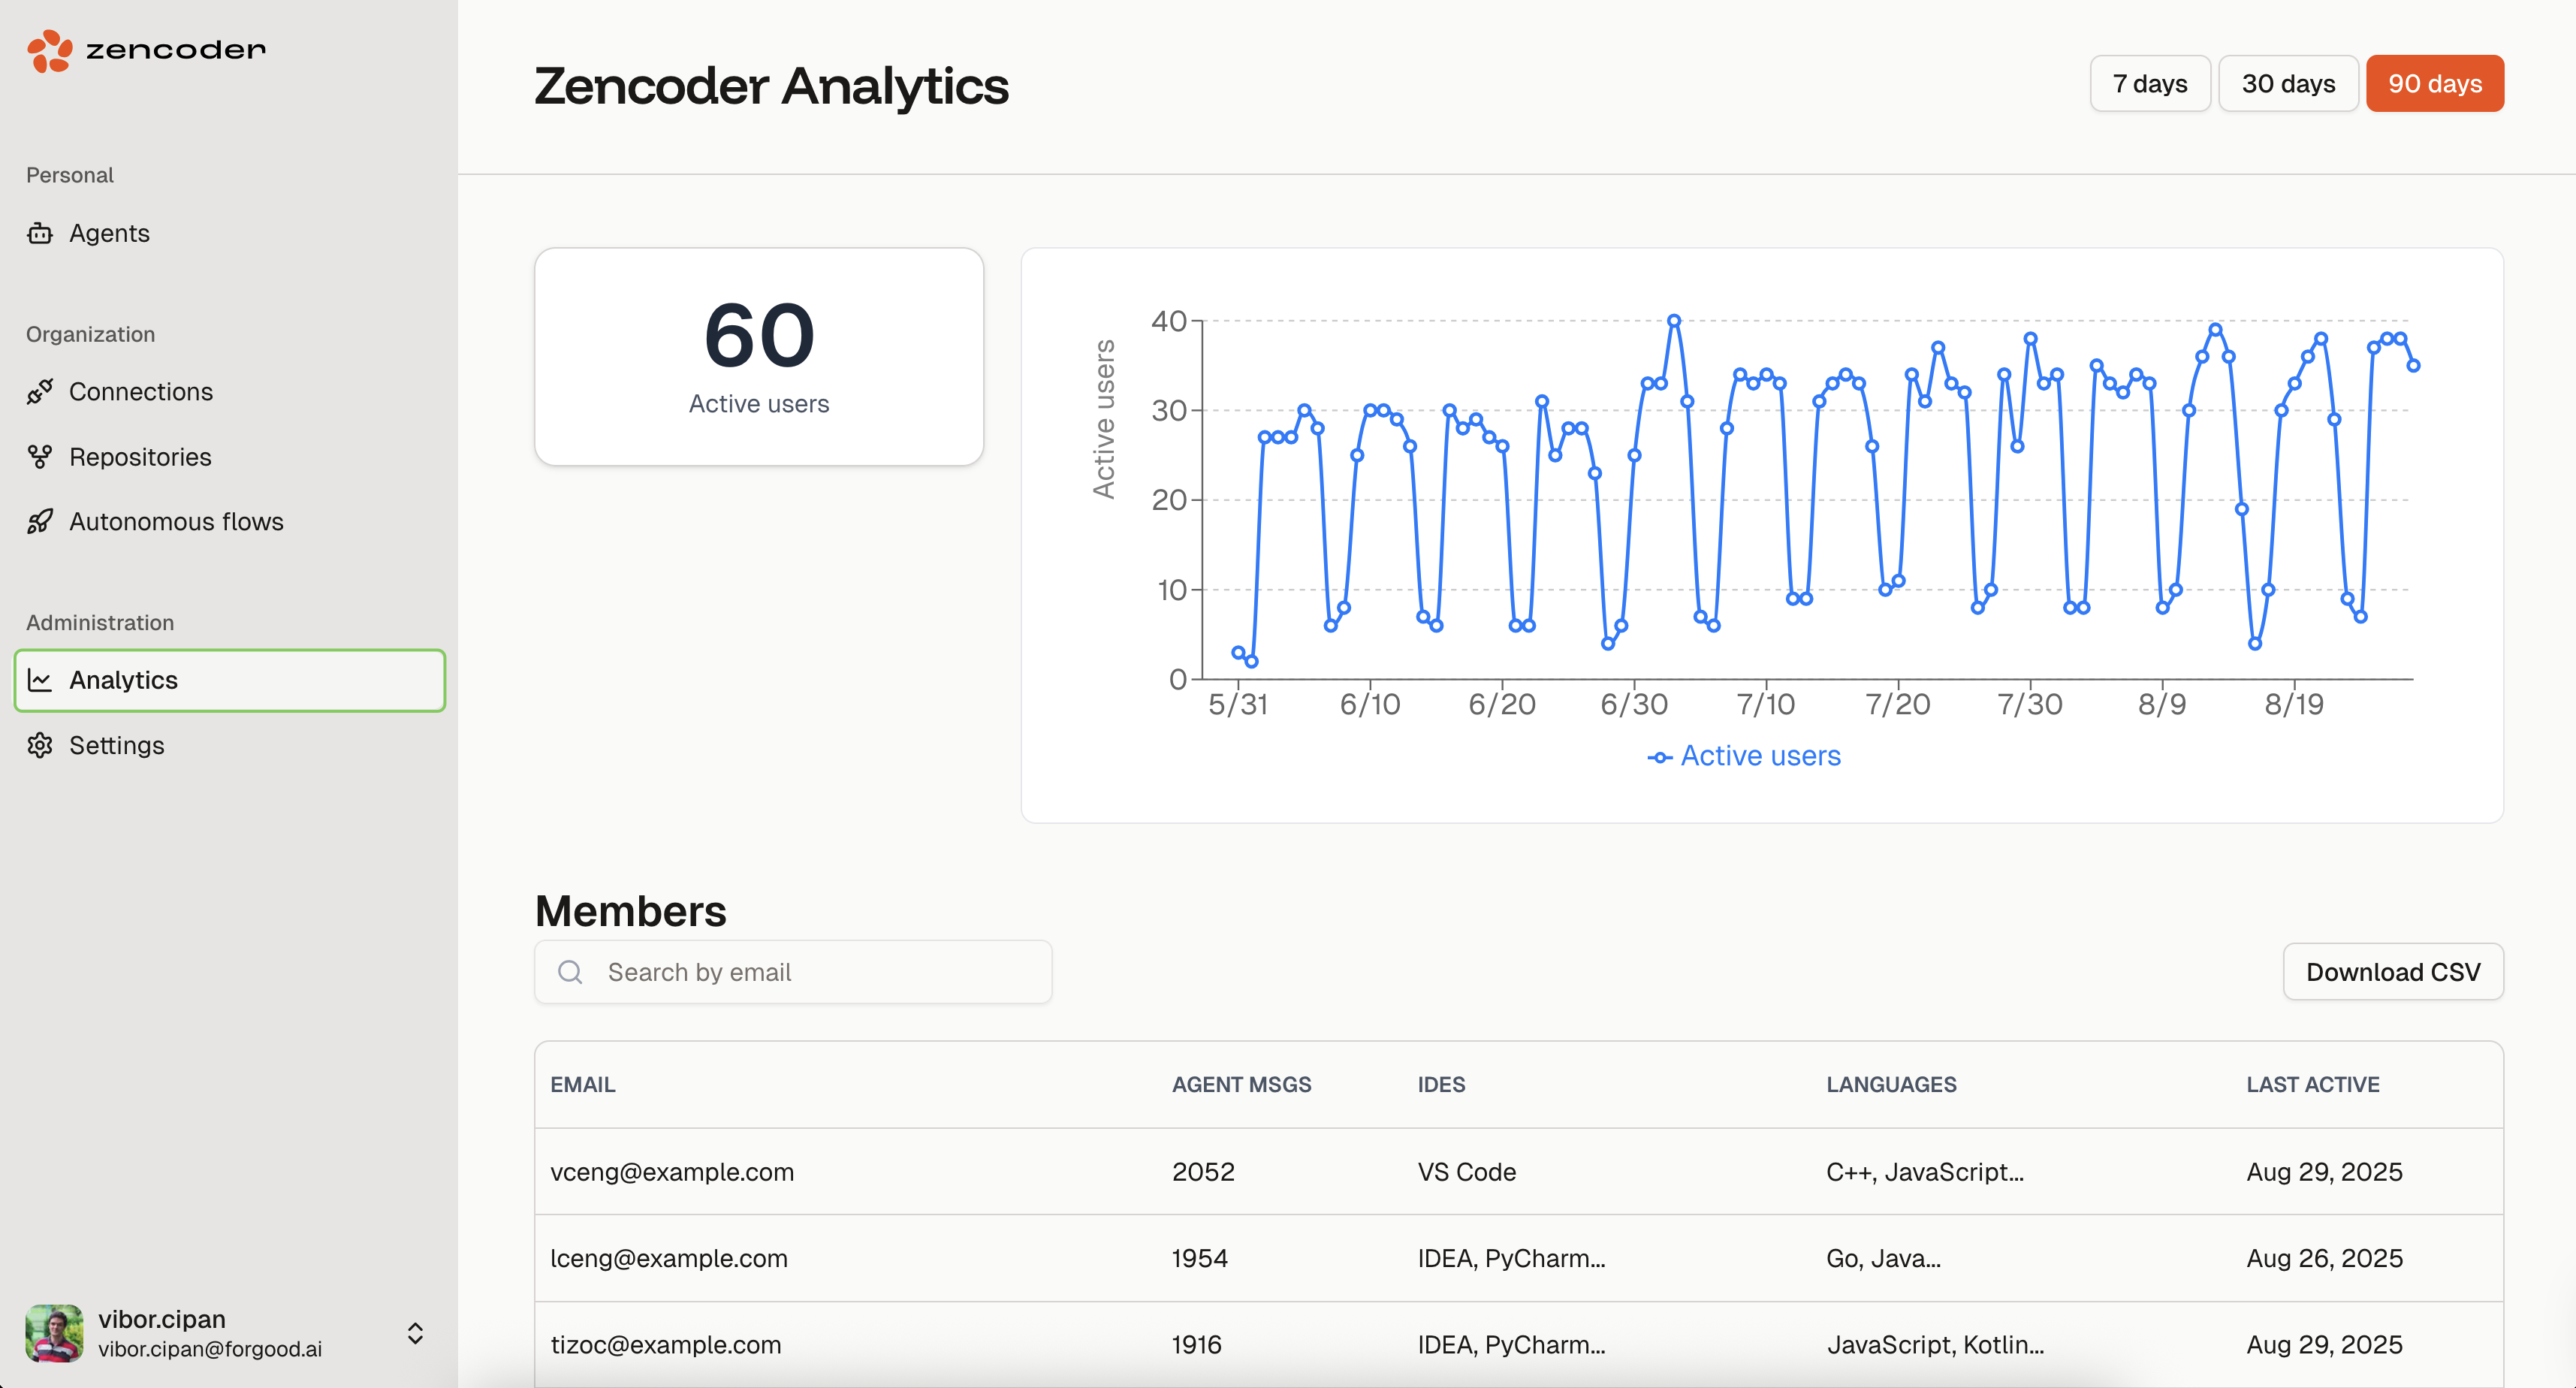
### Active Users Metric

Shows the total number of unique users who used Zencoder agents during the selected time period.

### Usage Trends Graph

Line chart of daily active users over time. Hover over a data point for exact counts.

### Time Period Filters

* `7 days` — recent activity
* `30 days` — monthly patterns
* `90 days` — quarterly trends

### Member Activity Table

Per-user breakdown:

<table>
  <thead>
    <tr>
      <th style={{width: '25%'}}>Column</th>
      <th style={{width: '75%'}}>Description</th>
    </tr>
  </thead>

  <tbody>
    <tr>
      <td><code>Email</code></td>
      <td>User email address</td>
    </tr>

    <tr>
      <td><code>Agent Messages</code></td>
      <td>Total agent interactions</td>
    </tr>

    <tr>
      <td><code>IDEs</code></td>
      <td>Development environments used by each member (VS Code, IDEA, PyCharm, etc.)</td>
    </tr>

    <tr>
      <td><code>Languages</code></td>
      <td>Programming languages used with Zencoder</td>
    </tr>

    <tr>
      <td><code>Last Active</code></td>
      <td>Most recent activity timestamp</td>
    </tr>
  </tbody>
</table>

<Tip>
  You can use the search functionality to quickly locate specific team members or filter by email domain to focus on particular teams or departments.
</Tip>

### Data Export

Download your analytics data as a CSV file for:

* Integration with existing business intelligence tools
* Custom analysis and reporting (including IDE and language distribution)
* Compliance and audit requirements
* Historical record keeping

## Best Practices

1. **Set baselines** — establish normal usage patterns so anomalies are visible
2. **Review regularly** — weekly or monthly check-ins on usage data
3. **Track onboarding** — monitor new user activity after rollouts
4. **Reallocate seats** — move unused seats to active teams based on actual usage
5. **Export for reporting** — CSV export feeds into BI tools or compliance audits

## Troubleshooting

### Analytics not visible in the sidebar / No data displayed

* Verify you have Owner or Manager permissions
* Ensure your subscription is Core or higher

### Missing Users

* Confirm users are part of your organization
* Verify users have authenticated at least once
* Check if filters are excluding certain time periods

### Export Issues

* Ensure your browser allows file downloads
* Check available disk space for CSV downloads
* Try a different browser if issues persist
